The Line Similarity tool is used to compare the lines in a line chart to a selected master line. As a result, two new columns are generated. The first is a similarity column, where the similarity to the master line is presented for each individual row (line). The second is a rank column, where the line most similar to the master line receives the rank 1. Correlation or Euclidean distance is used as the distance measure.
If "break on empty" is not active, empty values will be replaced using row (line) interpolation, similar to what is shown in the visualization. If "break on empty" is active, any rows (lines) containing empty values shall be excluded from the line similarity calculation.
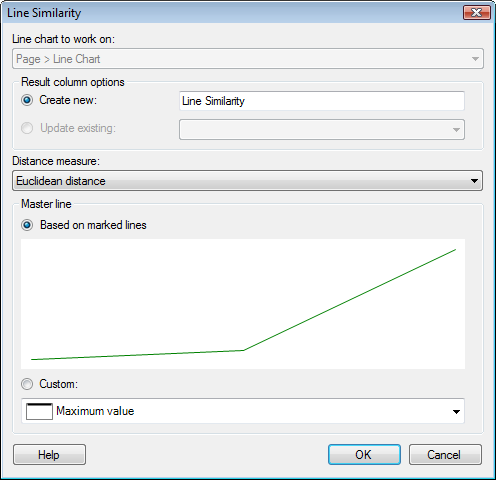
To reach the Line Similarity dialog:
Make sure you have set up a line chart according to the steps in How to Perform a Line Similarity Comparison.
Select Tools > Line Similarity....
Option |
Description |
Line
chart to work on |
Specifies which line chart will be used in the calculation (if there are more than one suitable line chart in the document). |
Result
column options |
|
Create
new |
Use this option to create new line similarity result columns. Create a new (calculation) is marked by default. Specify a name for the group, to which the two created columns belong. |
Update
existing |
Use this option to update previously added result columns. Only available when at least one line similarity has been calculated earlier. |
Distance
measure |
Select the distance measure to base the similarity calculation on. See Distance measures for more information. |
Master
line |
|
Based
on marked lines |
Use this option to search for lines as similar to the marked lines as possible. |
Custom |
Use this option to search for lines as similar to the shape selected in the drop-down list as possible. |
See also:
How to Perform a Line Similarity Comparison