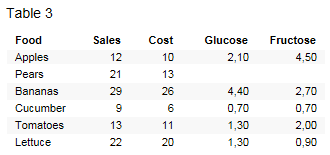
By inserting columns or rows, it is possible to combine data from different sources into a single data table that can be used in a visualization.
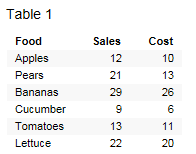
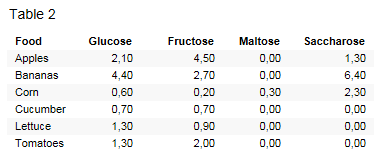
In this example, a data table containing information about the cost and sales for different kinds of fruits and vegetables (Table 1) has been joined together with another data table containing information about the content of Glucose, Fructose, Maltose and Saccharose (Table 2) per fruit and vegetables. In this case, two columns from Table 2 have been added (Glucose and Fructose) to Table 3.


See also: