Working with Data Tables
When you set up an analysis in TIBCO Spotfire, you may
want to be able to visualize data from more than one data table. Adding
other data tables is fairly easy; just select File
> Add Data Tables... and use the Add button to select the data
source of interest. See How
to Add Data Tables for more information. However, if you choose to
bring in a lot of data tables, you may find it difficult to keep track
of which data tables are related and which are not. Spotfire will add
some extra visual hints when more than one data table is available to
help you see which data tables are related. You may also want to view
which data tables have matching columns and therefore can be combined
in one visualization. Or simply view which data tables have already been
combined in a certain visualization.
You can always get a collected view of all data tables
in the analysis by selecting Edit > Data Table
Properties or View > Data which
opens the data panel.
A visualization can combine data from many data tables,
but one data table is always the main
data table, and works as the anchor point in the data for the visualization.
See Multiple
Data Tables in One Visualization to learn more about using many data
tables in one visualization.
Look for the data table selector
in the legend of the visualization.

Comment: When a new data table is added, the default
visualization created will normally show the legend with the data
table selector visible. However, any old visualizations created before
the second data table was added will not display their data table
selectors automatically.
If you cannot see the data
table selector in the legend, right-click in a white area of the legend
and select Data table.
Alternatively, in the Visualization
Properties dialog you can go to the Data
page and directly see which data table is being used, or, you can
go to the Legend page and display the
legend and the data table selector by selecting the appropriate check
boxes.
Comment: You can switch to a different main data
table from the menu on the data table selector.
The status bar at the bottom of the TIBCO Spotfire application
window displays information about the main
data table used by the active visualization (the visualization that
was last clicked upon).

The information displayed is:
the current number of filtered
rows,
the total number of rows in
the main data table (but if the data table is loaded on demand, then
the number of currently loaded rows is shown),
the number of marked rows,
the number of available columns,
the name of the main data
table in the active visualization.
Note that in-database data tables (external data) do not
have access to the detailed information about rows and columns since the
data shown in a visualization is aggregated by the external data source
and not within Spotfire.
Look at the color stripe on
the left-hand side of the title bar for the visualizations. Visualizations
using the same data table or related data tables will display the
same color on the color stripe.
Comment: The true color of the color stripe is
only visible for the active visualization and any related visualizations.
All unrelated visualizations are shown with a gray color stripe until
activated.
Click to activate a visualization
using an unrelated data table.
Response: The visualizations working on the new
data table get their relations color shown and the previously colored
visualizations become gray.
The filters from one data table are always grouped within
a single data table group, which can be expanded or collapsed in the filters
panel. Filters cannot be moved from one data table group to another. Note
that no data table group headers will be shown for in-database data tables
until filters have been created.
Look at the color stripe on
the left-hand side of the filters.
Comment: Filters belonging to the same data table
are marked with the same color stripe. The color used is identical
to the color of visualizations that use the same data table. Only
the filters belonging to the data table used by the active visualization
or any related data table show their true color. Other filters have
a gray color stripe. This is regardless of how filtering in related
data tables has been specified (whether the filtering in related data
tables affects the filtering in another data table or not).
Click to activate a visualization
using an unrelated data table.
Response: The filters working on the new data table
get their relations color shown and the previously colored filters
become gray.
When more than one data table is available, a color stripe
is added to the data table group and its subgroups and filters in the
filters panel. If two data tables are related, they will have the same
color in the filters panel. The currently active data table is written
in bold typeface in the filters panel.
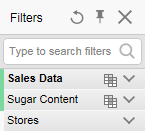
In the image above, the two data tables 'Sales Data' and
'Sugar Content' are related to each other (and the active visualization
uses 'Sales Data'), whereas the 'Stores' data table is unrelated to the
others. You can also check the relations between data tables in the Data
Table Properties dialog:
Select Edit
> Data Table Properties.
All related data tables will
have the same relations color. On the Relations
tab, you can change the relations color for a group of related data
tables.
Comment: The relations color is used in the title
bars of the visualizations as well as in the filters panel and in
the Details-on-Demand. You can change the Relations color for all
related data tables by selecting a different color from the drop-down
list.
Go
to the filters panel and locate the data table header for the data
table of interest.
Comment:
Note that you need to specify how each data table should respond to
filtering in all other related tables separately, to be certain of
what will be shown in the visualizations after filtering.
Click
on the Manage relations icon,  .
.
Response:
A drop-down menu is shown, where all related data tables are available.
Select
the data table for which you want to change how the filtering
should affect the current data table, and select one of the following
options: Include Filtered Rows Only, Exclude Filtered Out Rows or Ignore
Filtering.
Comment: See Filtering
in Related Data Tables for more information about the different
options.
See To_view_the_current_column_matches_in_the_analysis.
See To_view_the_current_column_matches_in_a_visualization.
See
also:
How
to Add Data Tables
Multiple
Data Tables in One Visualization
More
Examples