Option |
Description |
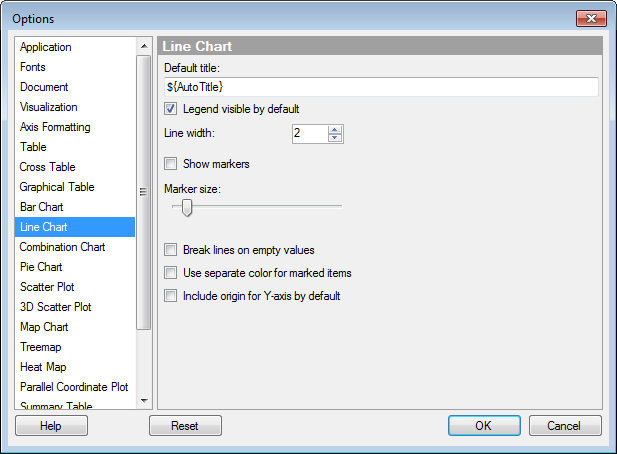
Default
title |
Specifies the default title for this visualization type. Tip: If you edit the title for a line chart and you want to use that title expression in all new line chart, then you can click on the Set as Default button in the Edit Title dialog directly. |
Legend
visible by default |
Specifies whether or not the legend should be open when creating a new line chart. |
Line
width |
Specifies the width of the lines in the line chart. |
Show
markers |
Determines whether or not markers should be displayed for the axis values. |
Marker
size |
Increases or decreases the overall size of the markers. |
Break
lines on empty values |
Determines whether lines should be broken or remain connected when an empty value is found in the data used to create the line. |
Use
separate color for marked items |
Select this check box to use a specified marking color (default is green) for marked items in this visualization type. If the check box is cleared, then unmarked items will be faded out instead. |
Include
origin for Y-axis by default |
Specifies that the visualization always includes the zero point of the Y-axis in the visualization, regardless of filtering. |
Reset |
Resets all properties on this page to the default values. Note that an administrator can configure which settings should be default for certain user groups on the server. If you are a member of such a group, the options on this page will be set to these defaults when you press the Reset button. |
See also: