Option |
Description |
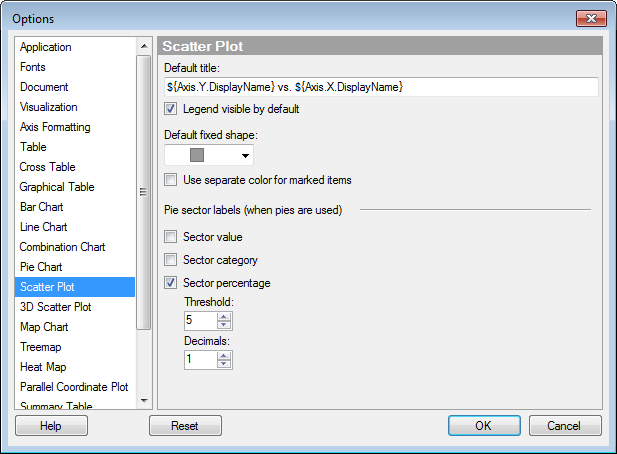
Default
title |
Specifies the default title for this visualization type. Tip: If you edit the title for a scatter plot and you want to use that title expression in all new scatter plots, then you can click on the Set as Default button in the Edit Title dialog directly. |
Legend
visible by default |
Specifies whether or not the legend should be open when creating a new scatter plot. |
Default
fixed shape |
Defines which shape to use for all markers as default. |
Use
separate color for marked items |
Select this check box to use a specified marking color (default is green) for marked items in this visualization type. If the check box is cleared, then unmarked items will be faded out instead. |
Sector
value |
Displays the value of the sector as a label. For example, sum of sales for apples, if the sector size is defined by sum of sales and the color is defined by fruit or vegetable type. |
Sector
category |
Displays the category defining the sector as a label. For example, "apples", if the sector color is defined by fruit or vegetable type. |
Sector
percentage |
Displays labels showing the percentage of the total that each sector represents. |
Threshold |
Excludes labels whose percentage falls below a given threshold. |
Decimals |
Specifies the number of decimals to display for the percentage value. The number specified here will also affect the number of decimals shown for pie sectors in the tooltip. |
Reset |
Resets all properties on this page to the default values. Note that an administrator can configure which settings should be default for certain user groups on the server. If you are a member of such a group, the options on this page will be set to these defaults when you press the Reset button. |
See also: