Option |
Description |
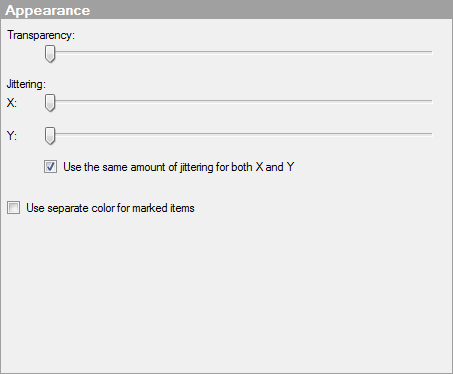
Transparency |
Drag the slider to change the transparency of the markers. This can be useful for instance when you want to see where markers are placed on top of each other, or if you want to be able to see lines or curves placed in the background more clearly through the markers. |
Jittering |
Jittering is an option that displaces the visualization items randomly in the display window, thereby making overlapping markers visible. |
X |
Specifies the amount of jittering to use in the horizontal direction. |
Y |
Specifies the amount of jittering to use in the vertical direction. |
Use
the same amount of jittering for both X and Y |
Select this check box to connect the jittering sliders in both directions to each other. |
Use
separate color for marked items |
Select this check box to use the specified marking color to distinguish marked items in this visualization. If the check box is cleared, then unmarked items will be faded out instead, and the original color will be kept for the marked items. See Marking in Visualizations for more information. |
See also: