Option |
Description |
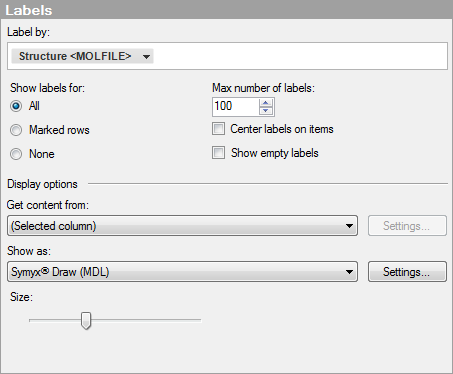
Label by |
Specifies the column or hierarchy whose values should be presented as labels in the visualization. |
Show labels for |
Determines whether to show labels on all markers (All), marked markers only (Marked rows), or not to show any labels at all (None). |
Max number of
labels |
Specifies the maximum number of labels to be shown. If the number is smaller than the available number of markers, the labels will be equally distributed. Note: This setting is not available when the markers are tiled. Go to the Shape page if you want to change marker shapes. |
Center labels
on items |
Places the label right on top of the marker instead of drawing a line from the marker to the label, which is the default behavior. This can be a way to use your own images as markers. Note: This setting is not available when the markers are tiled. Go to the Shape page if you want to change marker shapes. |
Show empty labels |
Shows labels that have no content. Note: This setting is not available when the markers are tiled. Go to the Shape page if you want to change marker shapes. |
Display options |
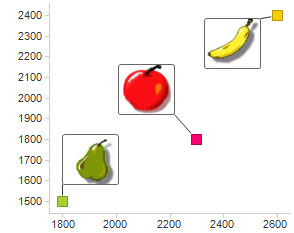
These settings are used when you choose to display anything other than plain text in your labels. For example, the labels could contain web links or images. |
Get
content from |
[Only visible if at least one virtual column producer is available.] Your company may have set up some type of virtual column producers that can take the values from the selected column and transform them in one way or another to produce a desired output. For example, if you have access to TIBCO Spotfire Lead Discovery you can select Structure Column here, in order to show molecular structures from an information link in the labels. For embedded images in the current data table, or when fetching data via a URL, you should leave this setting at (Selected column). |
Settings... |
If the selected source has some settings available, you can reach those by clicking on the Settings button. For example, this is where you would specify which information link to retrieve structures from when using TIBCO Spotfire Lead Discovery. |
Show
as |
Allows you to decide how the data in the selected column should be interpreted. For example, use Text for plain text labels. Use Image if there are binary images in your data that you want to use as labels. Use Link if the text should be interpreted as a web link. Use Image from URL if the image is picked from a web resource location. You may need to change the Link or Image from URL Renderer Settings by clicking on the Settings... button and modifying the link syntax so that it fits your current data. Once the URL to the image has been correctly specified you can see images in the labels.
Use Geometry if your data is a shape file and you want to show the geometrical shapes in the labels. If a TIBCO Spotfire Lead Discovery structure column is used to label by, then you would select a renderer for displaying structure images here. |
Settings... |
If the selected Show as method has some settings available that can be modified, you can reach them by clicking on the Settings button. For example, this could be Link Renderer Settings or Image from URL Renderer Settings for a web link, Geometry Renderer Settings or some structure renderer settings. |
Size |
Available if the selected label output is some kind of image. Increases or decreases the size of the labels. |
See also: