Option |
Description |
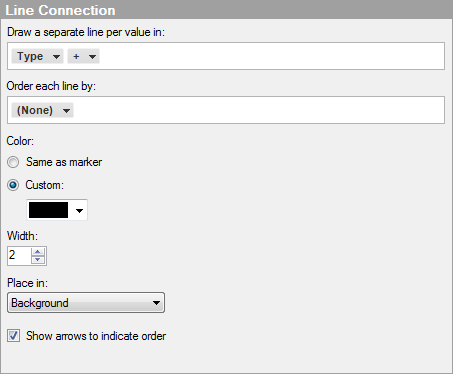
Draw
a separate line per value in |
Specifies the column or hierarchy containing the categories to use for line connection. Markers of the same category will be connected with each other to form a separate line. If no column or hierarchy is specified here, all markers will be connected with each other. |
Order
each line by |
Specifies the order in which markers are connected. If no column or hierarchy is specified here, the markers will be ordered by row index (the order of the rows in the original data table). |
Color |
Specifies how colors will be assigned to the lines. |
Same
as marker |
Choose this option if you want the lines to have the same color as the markers they are a connection between. If a line connects markers with different colors, the color of the line will be a fusion of the two colors. For example, when a blue marker is connected with a yellow marker the line between them will be green. |
Custom |
Choose this option if you want to use a single custom color for the lines. Click on the drop-down list to show the color selector where you can choose a different color. |
Width |
Specifies the width of the lines. |
Place
in |
Select whether the lines should be placed in the foreground or background of the markers they are connecting. |
Show
arrows to indicate order |
Specifies whether or not there should be arrows along the lines to indicate the order. |
See also: