Note: The settings on this page are not available when the scatter plot is set up with tiled markers. There are no size settings to apply to tiled markers since they have the same size by definition. Go to the Shape page to change marker shapes.
Option |
Description |
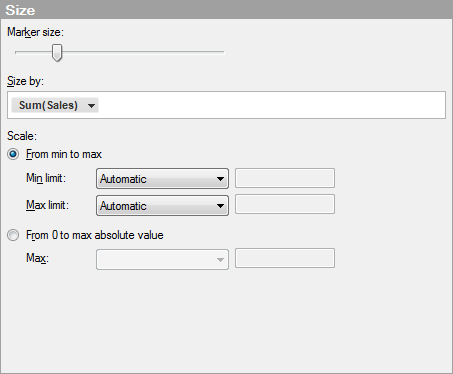
Marker size |
Increases or decreases the overall size of all markers. |
Size by |
Specifies a column or hierarchy whose categories will determine the size of the markers. The aggregation options on the drop-down menu are only available if the markers in the scatter plot have been aggregated by setting the Marker By option to something other than (Row Number). |
Scale |
Determines what scale to use for the size of the markers. |
From min to max |
Assigns the maximum marker size to the highest value, and the minimum marker size to the lowest value. For instance, if the minimum and maximum data values are -9 and 11 the marker sizes could be like the following:
This mode is useful when you want to visualize differences. |
Min limit Max
limit |
The minimum and maximum limits that should be mapped to the marker size. By default, they are set to "Automatic". This means that the marker size will adapt during filtering. If the scale is set to "From min to max", the current minimum value will have the minimum marker size, and the current maximum value will have the maximum marker size. It is comparable to automatic zooming on the X or Y axes. It is possible to lock the max limit and/or min limit to a specific value by selecting "Value" in the drop-down list and entering a value. Data values that are lower than the minimum value or higher than the maximum value will get the same size as the minimum and maximum value respectively. By specifying both a high and low value, the auto-scaling behavior is turned off. |
From 0 to max
absolute value |
This mode is useful when you want to compare the magnitude of measures. By letting the value 0 map to marker size 0, and the maximum value to the maximum marker size, it is possible to compare the diameter of markers and say "a" is twice as big as "b". With this scale the values 50 and 100 would be rendered like this:
Note: The size is scaled symmetrically around 0 with absolute numbers. That is, if your highest value is 10 and your lowest is -20, the size of the marker at 10 will be 50 percent of the maximum marker size. |
Max |
The absolute limit that should be mapped to the marker size. By default, it is set to "Automatic". This means that the marker size will adapt during filtering. The value 0 will have the minimum marker size and the highest absolute value in the visualization will have the maximum marker size. It is possible to lock this to a specific value by selecting "Value" in the drop-down list and entering a value. Data values that have a larger absolute value than the set value will get the same size as the maximum value. |
See also:

