Option |
Description |
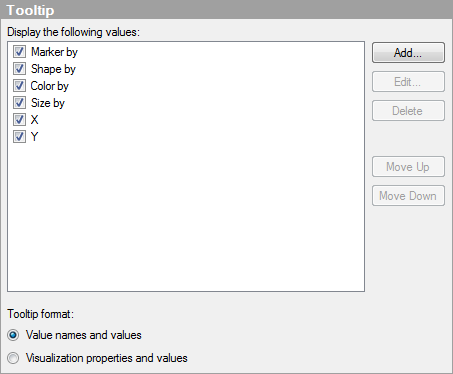
Display
the following values |
Specifies what will be shown in the tooltip. |
Add... |
Opens the Add Tooltip Value dialog, where you can add the content from another column, hierarchy, or any custom expression to be shown in the tooltip. You can also use images in tooltips. See Highlighting in Visualizations for more information. |
Edit... |
Opens the Edit Tooltip Value dialog, where you can change the information to be shown in the tooltip. |
Delete |
Deletes the selected value from the list. |
Move
Up |
Moves the selected value up in the list and, hence, up in the tooltip. |
Move
Down |
Moves the selected value down in the list and, hence, down in the tooltip. |
Tooltip
format |
|
Value
names and values |
Shows the tooltip content in a format where the selected column name, hierarchy or custom expression is displayed. For example, Year: 2003, Type: Cucumber, etc. |
Visualization
properties and values |
Shows the tooltip content in a format where the visualization property for each value is displayed. For example, X: 2003, Color: Cucumber, etc. |
See also: