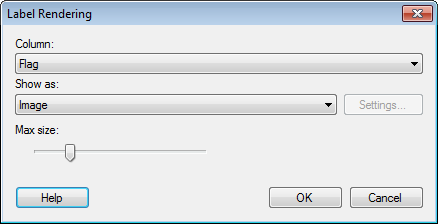
This dialog is used to determine how the values from a column used on an axis should be rendered in the axis labels. The dialog is reached from the Axis page in the Properties dialog of several visualizations.
Tip: For labels not on the axes, see the Labels page for the visualization type of interest.
Option |
Description |
Column |
If a hierarchy is used on the axis then this selector is used to determine which column the current settings should apply to. For example, you may have added both a "Country" and a "Flag" column to an axis and the flags should be shown as images whereas the countries should be shown as text. Note that hierarchies cannot be changed to anything other than text, so they will not show up in this list. |
Get content from |
[Only visible if at least one virtual column producer is available.] Your company may have set up some type of virtual column producers that can take the values from the selected column and transform them in one way or another to produce a desired output. For example, if you have access to TIBCO Spotfire Lead Discovery you can select Structure Column here, in order to show molecular structures from an information link in the labels. For embedded images in the current data table, or when fetching data via a URL, you should leave this setting at (Selected column). |
Settings... |
[Only visible if at least one virtual column producer is available.] If the selected source has some settings available, you can reach those by clicking on the Settings button. For example, this is where you would specify which information link to retrieve structures from when using TIBCO Spotfire Lead Discovery. |
Show
as |
Allows you to select how the data in the selected column should be interpreted. For example, use Text for plain text labels. Use Image if there are binary images in your data that you want to use as labels. Use Image from URL if the image is picked from a web resource location. You may need to change the Image from URL Renderer Settings by clicking on the Settings... button and modifying the link syntax so that it fits your current data. Use Geometry if your data is a shape file and you want to show the geometrical shapes in the labels. If a TIBCO Spotfire Lead Discovery structure column is used to label by, then you would select a renderer for displaying structure images here. |
Settings... |
If the selected Show as method has some settings available that can be modified, you can reach them by clicking on the Settings button. For example, this could be Image from URL Renderer Settings for a web link, Geometry Renderer Settings or some structure renderer settings. |
Max
size |
[Not applicable when images are shown in cross tables.] [Applicable when more than one image column is used on the axis and for specifying the size of images shown in tooltips.] Allows you to specify a max size to use when multiple image columns are used as labels on an axis. If only one hierarchy level with images is used then the size of the label images is determined by the space available in the visualization. You may be able to increase or decrease the size of the images by moving the axis, or by increasing the size of the entire visualization. Images are also automatically shown in the tooltips when used as axis labels. In this case, this slider is used to specify the size of the images in the tooltips. When more than one image column is used on the axis, the max size can be used to make sure that one of the images does not grow larger than the specified max size. |
See also:
Details on Add/Edit Tooltip Value