Error bars are used to indicate the estimated error in a measurement. In other words, an error bar indicates the uncertainty in a value.
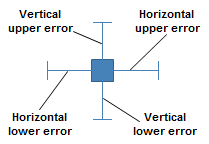
In Spotfire, you can use error bars in bar charts, line charts, and scatter plots. Bar charts and line charts can display vertical errors. Scatter plots can display both vertical and horizontal errors. The image below shows all four possible error bars on a scatter plot marker. However, upper and lower errors refer to the underlying data. This means that if you use reversed scales in a visualization, or change orientation of the bars in a bar chart, the error bars will also be reversed or change orientation respectively. For example, for a scatter plot with a reversed Y-axis, an upper vertical error will be displayed below the marker instead of above the marker. For a bar chart with horizontal bars and non-reversed scale, an upper horizontal error will be displayed to the right of the bar.
You can choose to show only one of the error bars, or any combination of them.
The length of an error bar indicates the uncertainty of the value. For example, for an average value, a long error bar means that the concentration of the values the average was calculated on is low, and thus that the average value is uncertain. Conversely, a short error bar means that the concentration of values is high, and thus, that the average value is more certain.
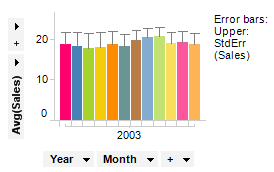
There are two different ways to set up error bars in Spotfire. For aggregated values, you can use one of the existing measures, such as standard error or standard deviation. The length of the error bars will then be calculated in Spotfire. In the example below, a bar chart shows the average sales for each month during one year. The statistical measure standard error was used to calculate the length of the upper error bars. No lower error bars were defined in this graph.
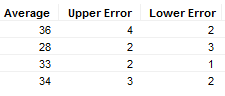
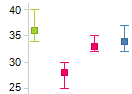
The other way to define error bars is to use the values in existing data table columns. You may, for example, have a data table where average values and error values have already been calculated, as in the table below. You can then use these columns to set up the error bars. In the scatter plot below, the Y-axis represents the column Average, and the upper and lower errors represent the two columns Upper Error and Lower Error respectively.
By default, error bars are drawn relative to the marker position in the visualization, but for some measures this may not be what you want to display. Custom expressions could be helpful in those cases.
For example, if a marker represents an aggregated value such as sales average, you may want to display the maximum and minimum values as error bars. However, if you select the measure Min for the lower error, and the measure Max for the upper error, the error bars will not show the minimum and maximum values, since the bars are shown relative to the marker position. Instead, the upper error shows the average plus the maximum value, and the lower error shows the average minus the minimum value. To display the absolute minimum and maximum values, you need to use a custom expression. In this case the custom expression for the upper error should be Max([Sales])-Avg([Sales]), and for the lower error Avg([Sales])- Min([Sales]).
To learn more about using custom expressions, see Custom Expressions Introduction.
See one of the following sections to learn how to set up error bars for different visualization types: To add error bars to the bar chart, To add error bars to the line chart, or To add error bars to the scatter plot.
Note: When you are working with error bars in bar charts, make sure that the bar chart is displayed using Side-by-side bars. Open the Appearance page in the Bar Chart Properties dialog if you need to change the bar chart layout.
See also:
Bar Chart Properties - Error Bars
Line Chart Properties - Error Bars