Adding rows to a data table
If you are working with in-memory data, you can add rows from a different source to your current data table. Data can be added from a local file, a data file previously saved in the Spotfire library (using the Windows client), or, you can add data directly from Google Analytics or from Salesforce, if you have access to those systems.
Even though data from different data tables often can be viewed in the same visualization, it may be preferred to actually incorporate similar data into a single data table. For example, if all columns are the same in the data sources and you know that you want to use summarized values from all sources in your visualization.
You add data from the
Files and data flyout
 .
.
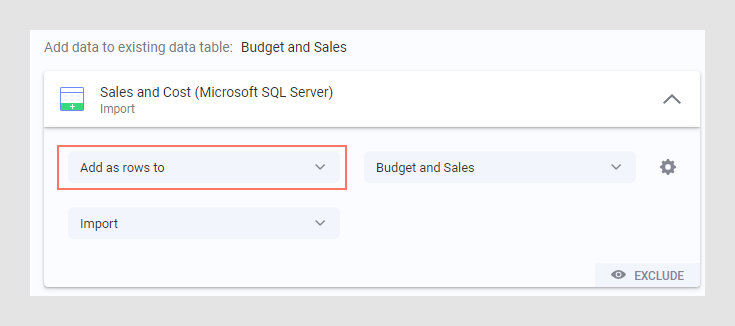
When you add data into your analysis, you can select to add the data as new rows in another data table, from the final step in the add data workflow:
You can also insert rows into a specific place in a data table, as described below.
Prerequisites
Procedure
Example: Adding rows from Salesforce
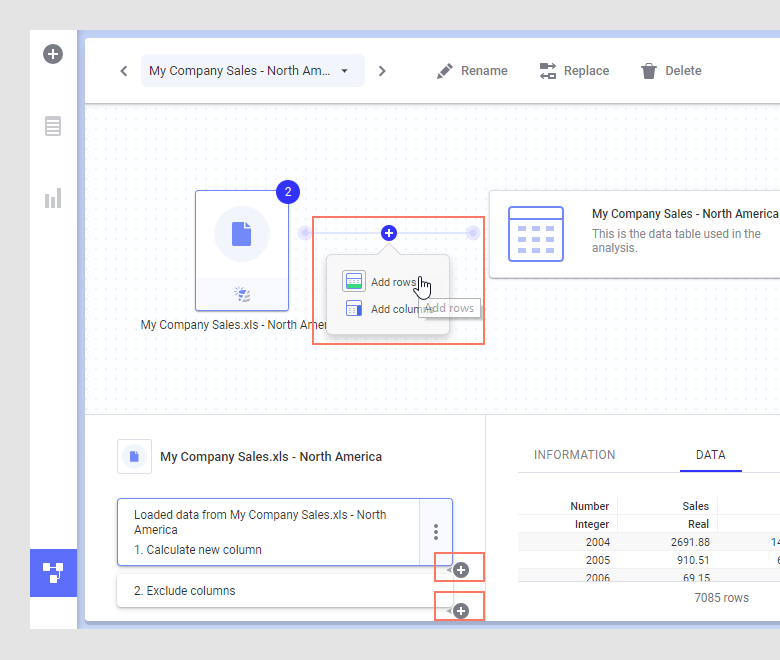
In this example, data has already been opened from a local Excel file. In the Data canvas, select the data table of interest, determine where you want to add rows (between the nodes in the graphical structure or between transformation groups), and click Add rows:
Choose a new or a predefined connection to Salesforce and sign in. Select the data to add and click OK. In the Add rows – match columns dialog, verify that the suggested column matching is valid, or add or remove matches between columns From original data and From new data. When you are satisfied with the data selection and settings, click OK to close the flyout and add the data.


 .
.
