Filtering data using the Data in analysis flyout
In your analysis, you can filter to data in which you are particularly interested and filter out the rest. The filtering can be handled from the Data in analysis flyout.
For more information, see
Filtering data.
Procedure
-
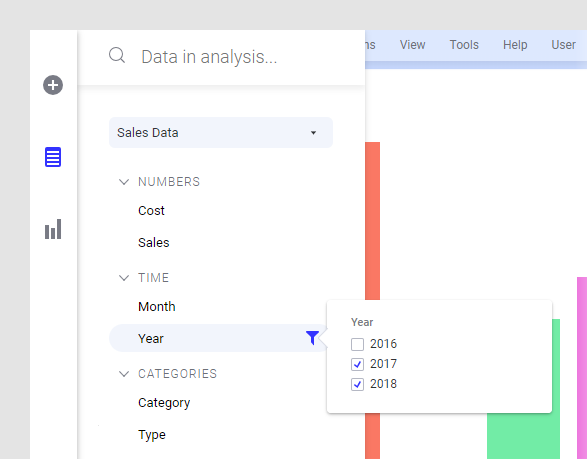
In the flyout, move the cursor over the column containing the values you want to filter out, and click
Show filter
 .
The filter associated with the column opens. One type of filter is shown below.
.
The filter associated with the column opens. One type of filter is shown below. - Repeat from step 2 to filter data in another column.
Example
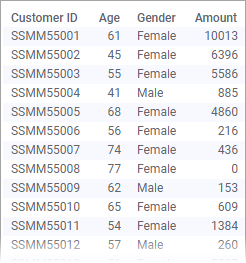
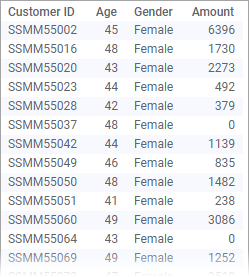
The data table below lists how much money each customer spent last time they visited a store. Also the customer's age and gender are registered.
What if you are interested in only showing purchases made by female customers between 40 and 50? Simply filter to these particular values using the
Data in analysis flyout as shown below.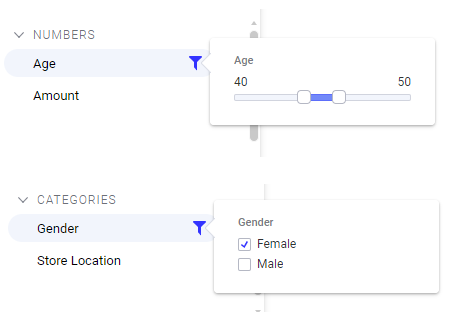
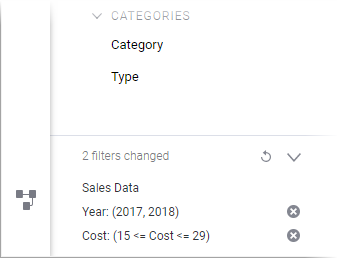
The data table, and every visualization based on it, will adjust to visualize only this limited part of the loaded data.
Copyright © Cloud Software Group, Inc. All rights reserved.