(Axis values)
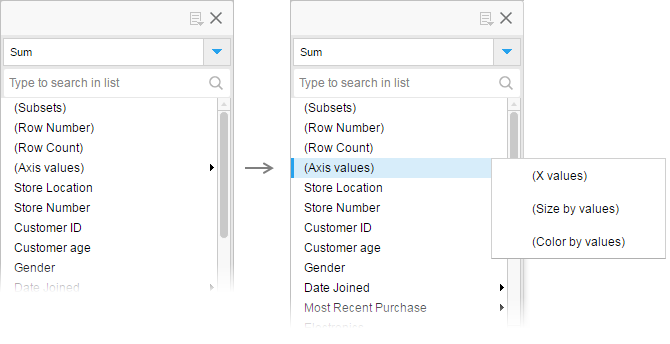
In column selector menus, you can encounter different (Axis values) options, for example, (Value axis values), (Color by values), and (X values). Such a non-column option represents the resulting values on the axis in question. It is especially useful for referring to axes with multiple columns.
Example
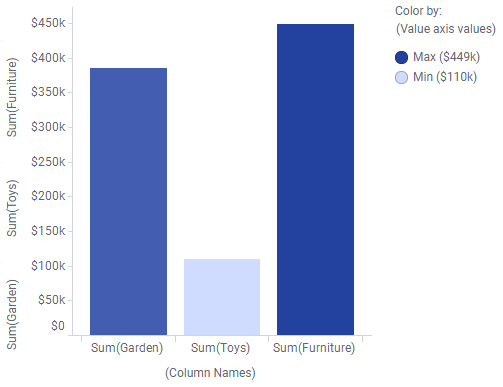
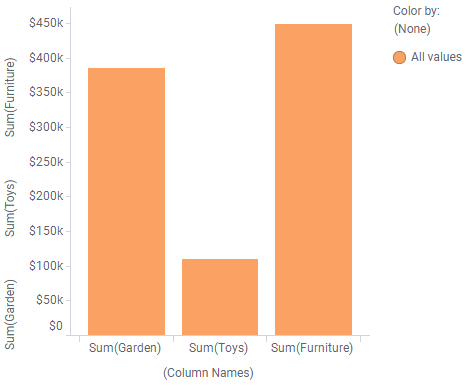
The bar chart shows the sums of sales at three different departments in a store. The data is retrieved from three columns, that is, more than one column is selected on the value axis.
By selecting (Value axis values) on the Color by axis, all bar values on the value axis become part of the coloring scale as shown below. This means you can use a single gradient scale when coloring the bars, even though they represent values from multiple columns.