Calculating profit in percent
The example shows how to use an custom expression to calculate the ratio between the net profit and the cost of investment.
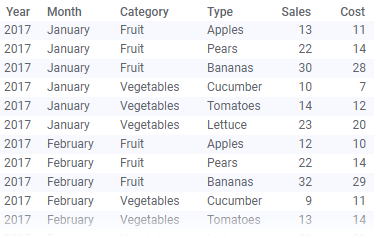
The data table below lists sales and purchase costs for a number of fruit types.
The bar chart, displaying the sum of sales for the different types, shows that the banana sales is highest.
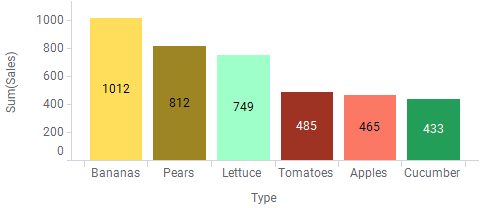
But is the bananas sales the most profitable when considering the purchase costs?
By applying the custom expression
(Sum([Sales]) - Sum([Cost])) / Sum([Cost])
that calculates the net profit in absolute values and then compares it to the purchase cost, the bar chart shows that sales of pears seem to be more profitable:
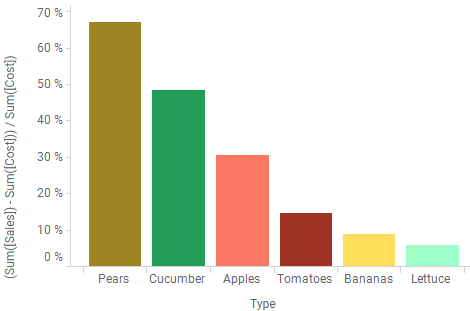
For every dollar you invest in pears, your net profit is $0.67, but for bananas only $ 0.09.