Sorting values in a cross table
In a cross table, the calculated values in the columns as well as the rows can be sorted.
Procedure
-
In the opened menu, beneath
Sorting, click
 to sort from lower to higher values, or click
 to sort the from higher to lower values.
Examples
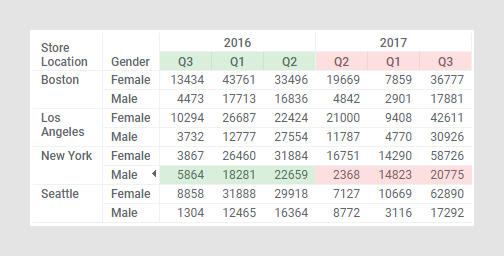
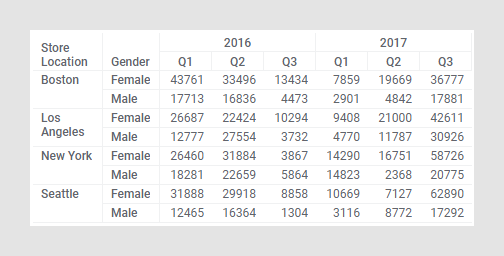
The cross table below displays data hierarchically on the horizontal axis as well as on the vertical axis. It shows quarterly sales figures for 2016 and 2017, split by location and gender.
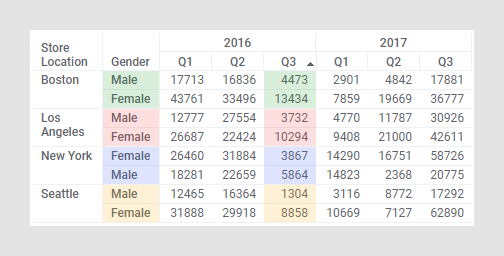
If you click a column header, for example Q3 in 2016, and select
in the menu, the values are sorted from lower to higher values within the last subcategories of the hierarchy. That is, the male and female sales figures are sorted in ascending order within each store location.
If you instead click a row header, for example Male in New York as shown below, and select
in the menu, the values within each of the last subcategories, Q1-Q3 2016 and Q1-Q3 2017, are sorted in an ascending order.