Adding a marker layer
Markers display positional coordinates on a map. The markers are customizable shapes that are placed on the map based on the position coordinates (latitudes and longitudes), or based on the geographic information provided in your data that represent zip codes, cities, counties, regions, or countries.
Prerequisites
The data must contain geographical or positional information. If the data contains no geographic coordinates (latitude and longitude), markers can be placed automatically in the center of supported administrative areas.
Procedure
Positioning markers on the map
Use the Geographic location property settings if you want to make changes to the automatic attempt to place geographical elements. Select Name-based geocoding to place markers according to the geographical name in the data. The markers for the geographical names are automatically positioned (by means of the geocoding tables) on the their geographical coordinates on the map. For more information on geocoding, see the Spotfire Analyst help topic What is Geocoding? Select Coordinate-based to place markers using columns in your data that contain coordinates.
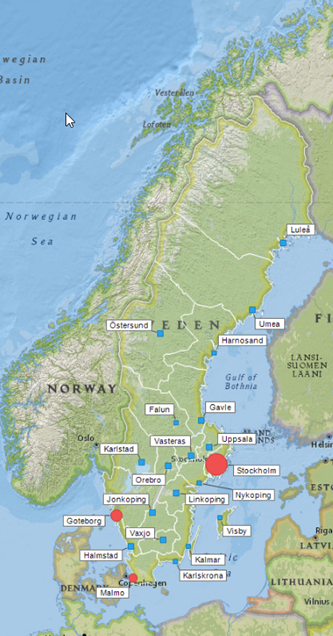
Marker layer example
This map chart shows Sweden with a nearly-transparent feature layer, showing county boundary lines, and a marker layer with the following properties.
- Title is set to Sweden county capitals.
- Appearance is set to opaque.
- Data is set to Sweden county capitals, with marking.
- Geographical location is set to Coordinate-based.
- Shape is set to Shape by column values, and the column set to cities larger than 200,000. (Three cities, Stockholm, Malmö, and Göteborg meet this condition (TRUE), so their shapes are filled circles, and all other county capitals are filled squares.)
- Legend is set to display, with Marking, Color by, Shape by, and Size by available.
- Color is set to Color scheme with two colors, Color by set to Sum(Population 2015) so smaller cities and towns appear in blue, and the larger cities appear in red.
- Size is set to Size by Sum(Population 2015) with marker size slightly enlarged. (Stockholm's marker is significantly larger but the smallest markers are still clearly visible.)
- Drawing order is not set because the map has no overlapping markers.
- Jittering is not set because the map has no overlapping markers.
- Line connection is not set.
- Labels is set to display the names of all county capitals.
- Showing directions using marker rotation in a map chart
Some marker shapes, for example arrows, indicate directions. If you, in a map chart marker layer, rotate such markers, you can visualize directions of motions. What you need is a column that contains values that can be interpreted as degrees.