Features display colored areas on a map. The features are administrative areas that are placed on the map based on the geographic information provided in your data and they represent zip codes, cities, counties, regions, or countries.
Procedure
-
Right-click the map chart visualization, and from the menu, click
Properties.
The
Properties popover is displayed, with the
Map chart popover showing the current layers, in their layer order, top to bottom.
-
Click
Add new layer at the bottom of the
Map chart list.
A list of the layer options is displayed.
-
From the list, click
Feature layer.
-
From the menu that opens, select the data table to draw the features from; either one of your own data tables at the top of the menu, or one of the available geocoding tables.
For more information on geocoding, see the
Spotfire Analyst help topic
What is Geocoding?
The feature layer is added to the
Map chart layer list, the
Properties list for the layer is displayed, and the layer with its default settings is added to the map chart.
- Optional:
Drag and drop the layer to a new position on the list.
-
Review properties for the map chart to refine the display.
Tip: You can reuse the settings of an already existing layer. Select
Duplicate layer in the
Properties popover to duplicate either the selected layer in the same map chart, or to add a copy of a layer from another map chart in the analysis. See
Duplicating a layer for detailed instructions.
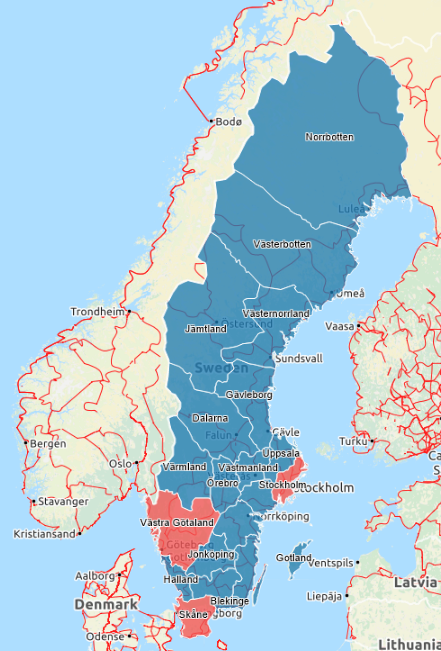
Feature layer example
This map chart visualization shows Sweden, using two data tables: Sweden Counties and Sweden county capitals. The data includes added census information from 2015, and it has a calculated column indicating cities with populations over 200,000. The map chart visualization includes a feature layer with the following properties.
- Title is set to
Sweden Counties (Län)
- Appearance is set to semi-transparent (displaying the OpenStreetMap cycling map TMS layer beneath it).
- Data is set to the data table
Sweden county capitals - Swedish Counties (Län).
- Geographic location is set to
Feature by
County (län).
- The
Legend check box is cleared.
- Color is set to the following values.
- Color by:
Larger than 200000 (an added calculated column).
- Color scheme: 2 colors.
- Color items:
True (over 200,000) and
False (under 200,000), with color selections customized to blue and red.
Labels is set to
First(County (län)).
The result is that the counties with cities over 200,000 (Stockholm, Västra Götaland, and Skåne) are the first color, while all other counties are the second color.
Tip: You can add your own features. For information about creating your own features, see the following articles. (These articles are in the TIBCO Spotfire Community site. It is free to use but requires log in credentials.)
Copyright © Cloud Software Group, Inc. All rights reserved.