Adding a zoom slider
Zoom sliders are used to get a closer look at details in your visualization.
The line charts below illustrate the use of a zoom slider. The line chart at the top shows sales from Q1 2015 to Q4 2016.
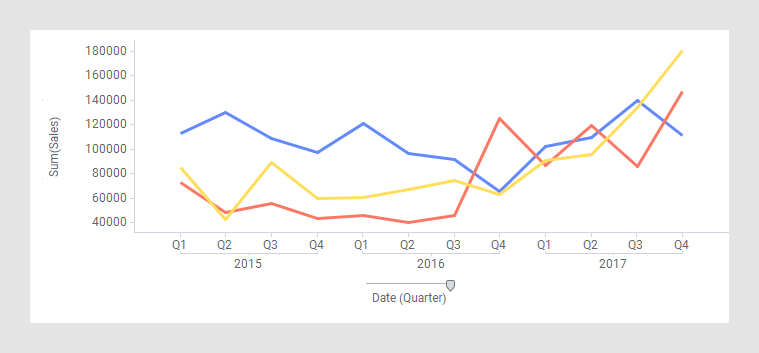
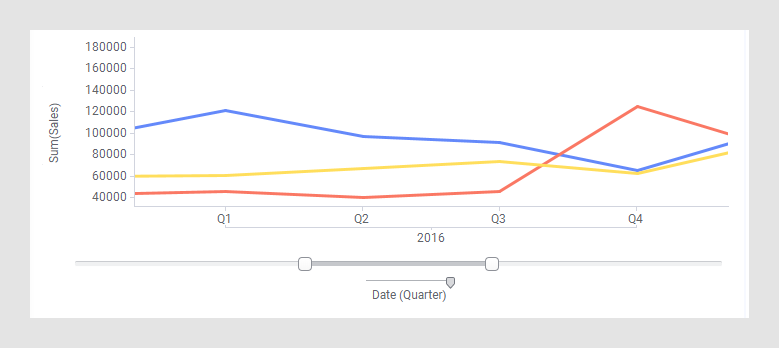
By adding a zoom slider to the line chart, and then adjusting it by dragging its handles, you can look closer at, for example, the quarters in 2016.
Procedure
Copyright © Cloud Software Group, Inc. All rights reserved.