Data preparation in Microsoft Excel
Before loading a Microsoft Excel file into an analysis, it is important that the data spreadsheet is free from irrelevant information and has a good structure to prevent misinterpretation. Possible actions that can be done before loading data are removing contextual information and combining columns into one.
The tabular format of the data in an Excel spreadsheet will be represented as a data table in your analysis. The first row with data in the spreadsheet will be interpreted as names of the data columns in the table, and the following rows will be interpreted as data rows.
Remove contextual information
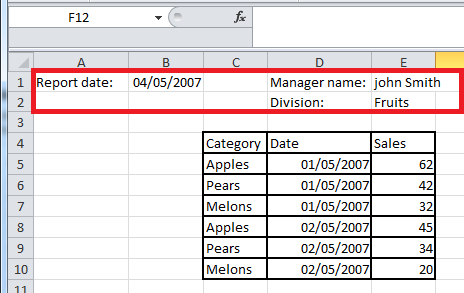
The following illustration shows a spreadsheet containing some contextual information above the actual data table. This will cause misinterpretation of the data.
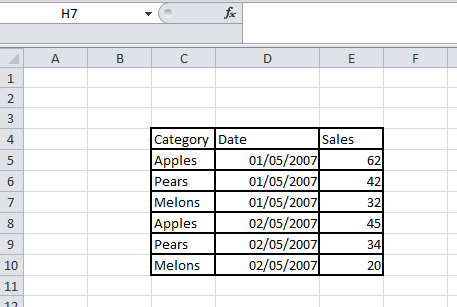
Remove any contextual information before loading the data, to get good results. In the sheet below, there is no contextual information before the actual data set, so it will therefore be interpreted correctly.
Combine columns
The data can be organized in different ways, short/wide or tall/skinny, but still contain the same information. Often, it is easier to visualize data organized in a tall/skinny format. You can transform your data in Spotfire by unpivoting columns, but if you are more comfortable with doing this work in Excel, it can also be done before uploading the data to Spotfire.
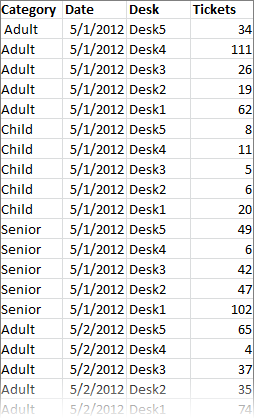
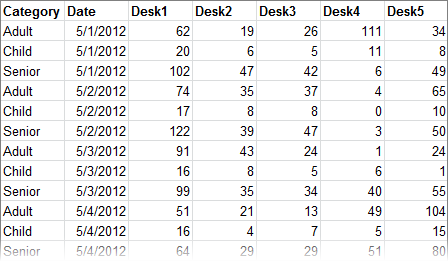
For example, the following Excel spreadsheet contains the numbers of sold entrance tickets for five different desks. The data is organized in a short/wide format, that is, the spreadsheet has many columns with similar data.
In the spreadsheet below, the same data is organized in the tall/skinny format. The values from the desks have been combined in one column.