Collaborating when analyzing data
Collaboration with others on an analysis can be done by exchanging comments in a conversation. You start a conversation by inserting a comment, for example, to discuss what is visualized, or to ask for advice. The replies are then added in a sequence to the conversation thread.
The comments exchange is done in a specific mode that is turned on and off by clicking
Collaboration
 on the menu bar. When the mode is turned on, a floating toolbar is available.

Using the top button, you start a conversation by posting a comment within a visualization. Replies can then be added to your comment. Clicking the bottom button opens a panel, where you can browse conversations that already exist to get an overview of what has been discussed. From here you can open an entire conversation to view the comments and add replies.
A conversation thread, anchored at the
 symbol in a visualization, is shown below.
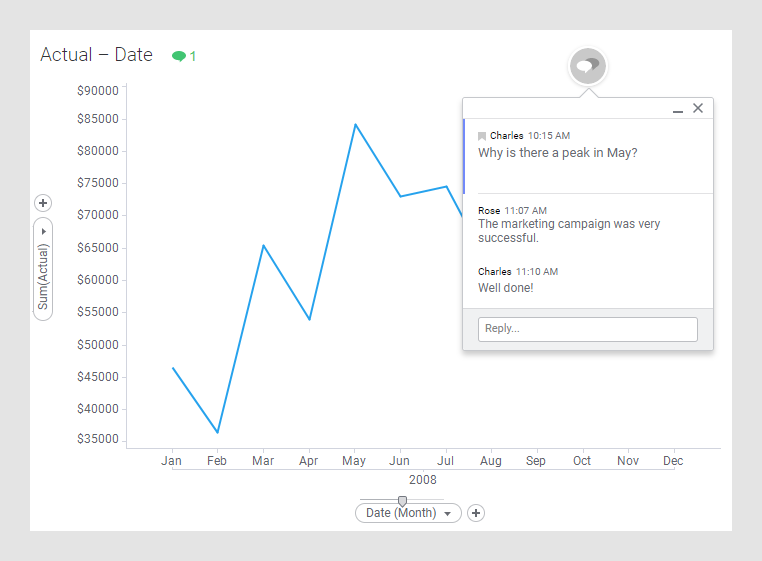
Typically the context in which a comment is made is relevant for what is communicated. Therefore, posting the first comment captures not only a text message, but also the current state of the analysis. The state includes, for example, what is filtered, and what is marked in the current view, and on which position in a visualization the comment is made. In that way you can draw attention to data of specific interest, and comment on it. Clicking the comment later on will immediately open the conversation in this captured context.
Replies that are posted in the thread can be pure text messages, or if your message benefits from referring to another state of the analysis, you can include this state in the post. Clicking a reply with an included analysis state will open the thread in this state of the analysis.
All comments that include captured analysis states are indicated by a
 symbol, and will be opened in the analysis states, in which they were added.
A conversation thread can deal with anything from details in a particular visualization to the overall analysis. It will, however, reside in the visualization where the first comment was posted. If you move the visualization to another position, the thread will follow.
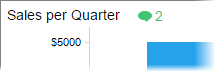
You can start as many conversation threads as you need. How many conversation threads that are related to a visualization is displayed in the visualization title. If you click the number, only these threads will be shown in the Conversations panel.
Conversations panel
The Conversations panel lists the existing conversations in an analysis.
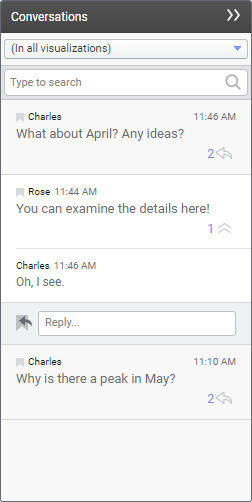
The conversations are listed in a chronological order with the conversation most recently updated at the top. The number of current replies is shown in the lower right of the initial comment.
From the panel you can choose to expand the full conversation within the panel (click
 to expand it and
 to collapse it), or to open it in the context it was added (click the initial comment). Replies can also be added from within the panel.
A search field is provided so you can look for specific conversations.