Creating a table
The table visualization presents all details of the loaded data. The individual values are arranged in columns and rows.
Procedure
-
On the authoring bar, click
Visualization types
 to open the flyout.
-
Drag the
Table visualization type to the wanted position on the analysis page.
Example
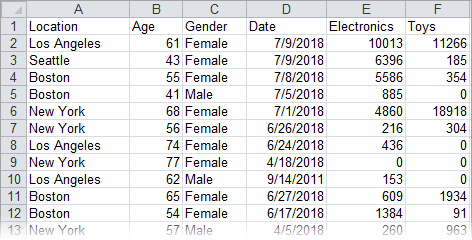
Assume you load the Microsoft® Excel file below.
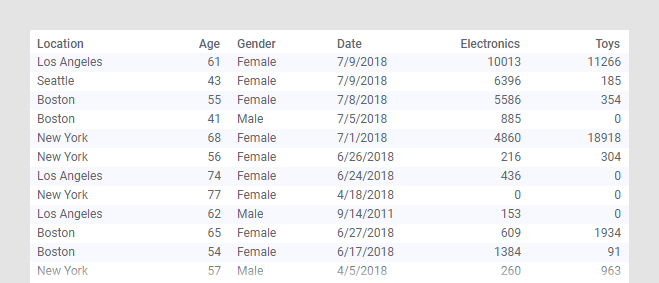
Below, the loaded data is presented in a table visualization.
Copyright © Cloud Software Group, Inc. All rights reserved.