Marking items
You can mark items in a visualization to view details for the items or to clarify connections between visualizations. Marking, for example, a pie sector or a bar is equivalent to marking all the data rows that are included in that pie sector or bar.
The following actions result in marked items:
- Click an item
– marks the item and unmarks previously marked items
- Press Ctrl + click an item
– adds or subtracts items from the marked set of rows
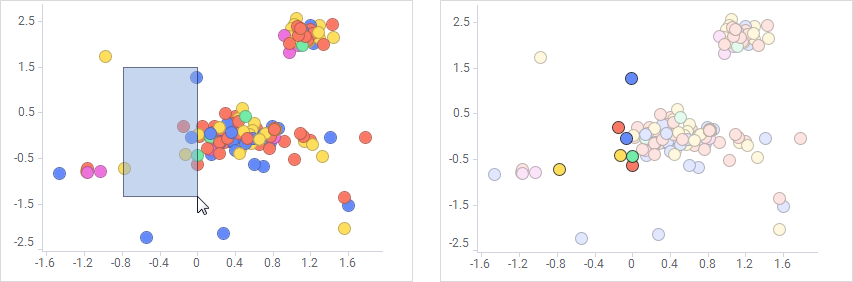
- Drag a rectangle
– marks all items within the rectangle and unmarks all other items
- Press Ctrl + drag rectangle
– adds items within the rectangle that are not already marked to marked items
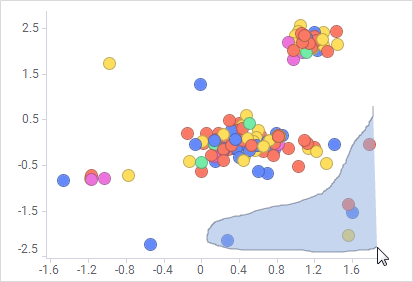
- Press Alt + draw a shape of any form (lasso marking)
- Press Ctrl + Alt + draw a shape of any form
– toggles items within the shape to the opposite of marked/unmarked
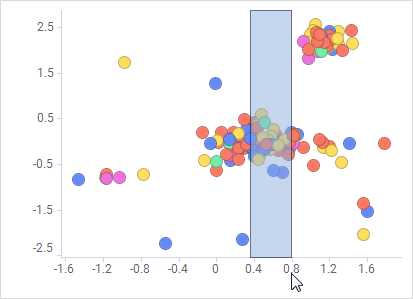
- Click the scale label area and drag along any of the axes
- Select categories in the legend
– marks all items of a certain category. For more information, see Marking items using the legend.
Copyright © Cloud Software Group, Inc. All rights reserved.