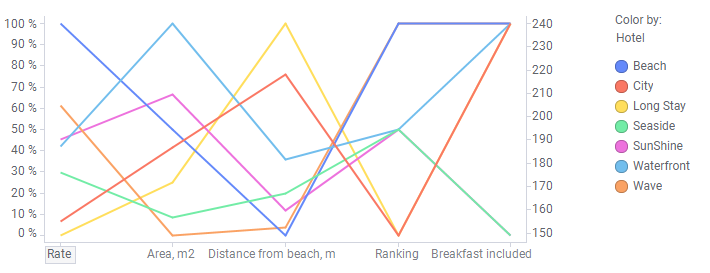
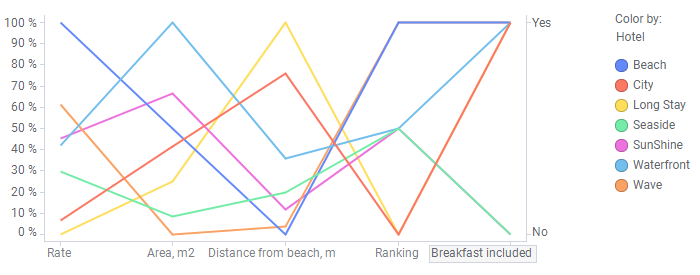
Displaying actual values in the parallel coordinate plot
In the parallel coordinate plot, the values are normalized and expressed as a percentage. The percentage scale is displayed to the left in the visualization. It is possible, though, to display also a scale for actual values. The scale can be displayed to the right in the visualization for one column at a time.
Procedure
Copyright © Cloud Software Group, Inc. All rights reserved.