Example 5: Cox Model with Time-Dependent Covariates
- Overview
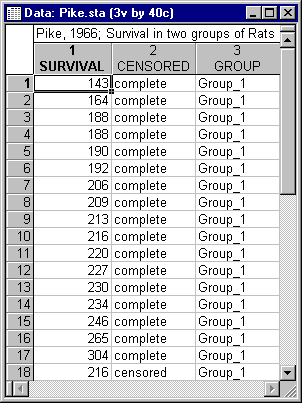
- This example is based on a data set reported by Pike (1966) describing the survival times for two groups of rats that had been exposed to a carcinogen. Open the
Pike.sta data file using the
File - Open Examples menu; it is in the Datasets folder. The following image shows a partial listing of that file.
Suppose we suspect that the effect of the treatment (exposure to carcinogen, coded in variable Group) on the underlying hazard is not constant; that is, that the proportionality assumption might be violated. To test whether this assumption is tenable, a model is fit to the data that includes both the fixed covariate Group as well as a time-dependent variable defined as Group * (Log(Time)-5.4). Note that the value 5.4 is used for scaling purposes here, since the mean of the log-survival times is approximately equal to 5.4.
Specifying the Analysis
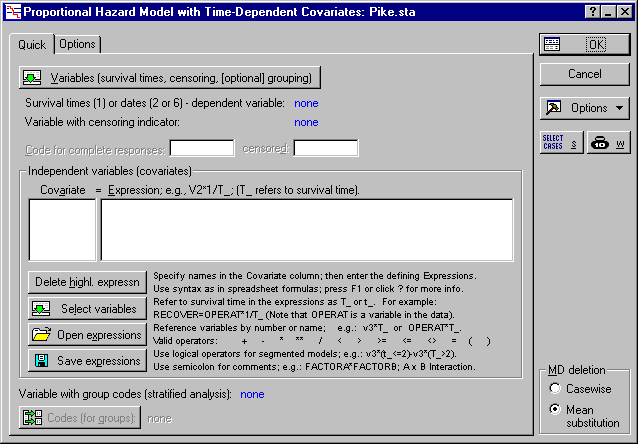
- Select Survival Analysis from the Statistics - Advanced Linear/Nonlinear Models menu to display the Survival and Failure Time Analysis Startup Panel. Double-click Time-dependent covariates to display the Proportional Hazard Model with Time-Dependent Covariates dialog box.
-
Click the Variables (survival times, censoring [optional] grouping) button to display the standard variable selection dialog box. Here, select variable Survival as the Survival (1, 2 or 6), variable Censored as the Censoring variable, and then click OK.
- Double-click the Code for complete responses field to display the Variable 2 dialog box. Here, select Complete and click OK. In the same manner, double-click the censored field and select Censored.
Specifying Time-Dependent Covariates
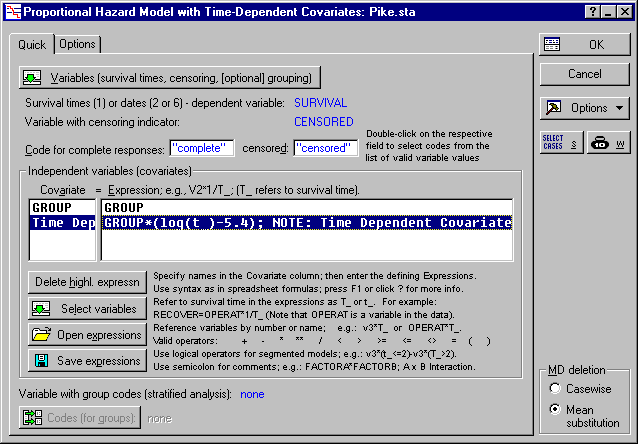
The Proportional Hazard Model with Time-Dependent Covariates dialog box has two editable (and scrollable) fields. The left column Covariate can be used to enter a label for the covariate that is used later in the output. The right (wider) column Expression can be used to define the respective covariate using an arithmetic expression.
Rather than typing in the names of the covariates, begin by clicking the Select variables button under Independent variables (covariates) and a standard single variable selection dialog box is displayed. The variables that you select here are automatically transferred into both edit fields, that is, into the Covariate field and the Expression field. Thus, this is a quick way to specify fixed covariates, or to transfer variable names one wants to transform into the edit fields. Select the Group variable and then click OK. Variable Group is transferred into the first line of the edit fields.

Repeat the selection of variable Group, and identical text appears in the second line of the edit fields; then modify the second line as shown.
Reviewing the Results
Click OK button to begin the analysis. The Model Parameter Estimation dialog box is briefly displayed. After the best parameters have been found by Statistica, the iterative procedure stops and the Regression Results dialog box is then automatically displayed. Click the Summary: Parameter estimates button on the Quick tab.
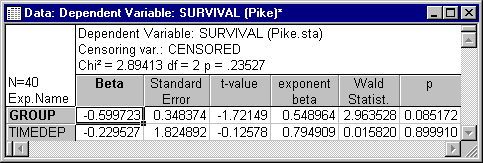
As you can see, the parameter estimate for the time-dependent covariate is much smaller than its standard errors, and not statistically significant. Thus, the model with the single fixed covariate does not appear to be inappropriate.