Compound Graph Customization
- Collections of independent graphs
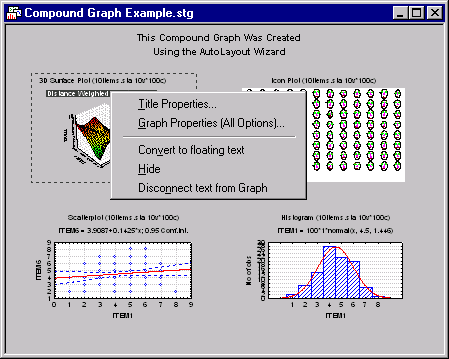
- Individual graphs within certain types of compound graphs (e.g., those made via the AutoLayout Wizard, Multiple Graph Templates, or specialized graphs from statistical analyses) can be selected and customized individually.
To select a single graph in a compound graph, click outside the plot area of the individual graph (i.e., on the outer background of the graph). The graph will be surrounded by an animated border, and you can select specific features of that graph (e.g., point markers, fit lines) by double-clicking on them.

To select the entire plot for customization via the Graph Options dialog, double-click outside the plot area of the individual graph.
Double-clicking on the common background of the compound graph (or right-clicking on the background and using the shortcut menu) provides access to customizing the compound graph's features independently from the contained graphs.
- Multiple graphs
- Graphs of the same type within a single compound graph created via STATISTICA's Graphs menu graphs procedures (e.g., categorized graphs, matrix plots, scatterplots with histograms, or scatterplots with box plots) allow customization of features on all of the like graph types simultaneously. That is, on a graph that has four histograms and twelve scatterplots, the twelve scatterplots can be customized independently. Double-clicking on a specific feature (such as an axis) will display a dialog to quickly address altering that feature on all the scatterplots at once. A single-click selects the feature to be customized on all the like graphs (e.g., single-click the x-axis in one scatterplot, and the x-axis in all other scatterplots is selected as well). Double-clicking on the common outer background of the compound graph (or double-clicking on the inner background of any one of the graphs) displays the Graph Options dialog for customizing features of all the scatterplots simultaneously as well as for customizing the container graph.
Copyright © 2021. Cloud Software Group, Inc. All Rights Reserved.
