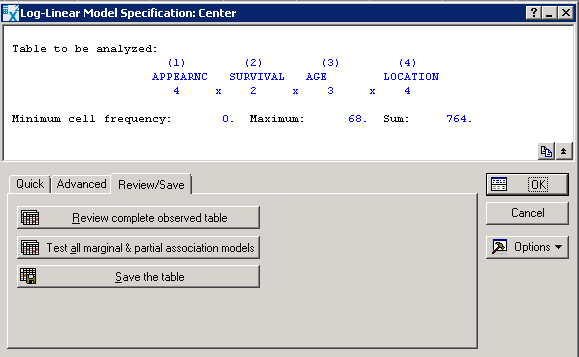
Review/Save Tab
Select the Review/Save tab of the Log-Linear Model Specification dialog box to access the options described here.
| Element Name | Description |
|---|---|
| Review complete observed table |
Click the Review complete observed table button to display the Specify how to Review the Table dialog box. In this dialog box, select the two variables by which to view the multi-way frequency table in the most flexible manner, slice by slice. If there are more than two factors in the table, you can view any two-way table within each of the levels of the remaining factors. A particularly useful Graph of Input Data for all tables is the 3D histogram. |
| Test all marginal & partial association models |
Click the Test all marginal & partial association models button to display a spreadsheet with the test results. The utility and interpretation of these tests are described in the Introductory Overview section. Note that these tests are actually computed only the first time the Test all marginal & partial association models button is clicked. Thereafter (unless you return to the Startup Panel), these tests are stored in memory and are available instantaneously. |
| Save the table | Click the Save the table button to display the observed table, including coding variables (indicating the levels for each factor) and a variable named Frequency that contains the frequencies for each cell in the table, in a standard Statistica spreadsheet (shown in an individual window, regardless of the settings in the Options dialog box - Output Manager tab or the Analysis/Graph Output Manager dialog box). You can, however, add the spreadsheet to a workbook or report using the or buttons, respectively. |

