Axis: Scaling
The options described here are used to customize the scales for each of the graph axes. These options are available on the Axis: Scaling tab of the Graph Options dialog box.
Separate options are available for each graph axis and the changes that you make for each axis are independent of one another (unless any of the Copy to options are selected to transfer the settings to other axes, see below). Therefore, the following descriptions of the scale options apply to each axis in the graph. Note that options for modifying scale values are available in the Axis: Scale Values tab.
- Axis
- Although all of the options are the same for each axis, you can make changes to each axis independently of the other. Select here the axis (X, Y-left, Y-right, or Top axis for 2D graphs, X, Y, or Z axes for 3D graphs, or X, Y, Z, or V axes for triangular axis surface graphs) to which you want to make changes.
- Copy axis specs to
- Instead of manually selecting the same specifications for each of the axes, click this button to display the Copy axis specs to dialog box. Use the options in this dialog box to automatically copy to the remaining axes.
- Range
- The settings in this group box determine the range (i.e., stop and start value) for the selected axis.
- Mode
- Choose one of two scaling methods. The method you choose here determines whether the minimum, step, and maximum scaling values of each axis will be set automatically by STATISTICA (Auto) or manually by the user (Manual). The steps will be determined by "counting" from the current minimum (value of Minimum). You can edit the step size on the Axis: Major Units tab or by clicking the Edit step button.
- Edit step
- Click this button to display the Axis: Major Units tab, where you can edit the step size.
- Minimum, Maximum
- These fields determine the minimum and maximum scaling values for the current axis. They are available only if you choose the Manual scaling option (see above).
- Automatic range options
- When you select one or more of the options in this group box, STATISTICA will automatically apply them to your plot regardless of which mode you have selected above. Select Start from zero to determine the steps by "counting" from 0, even if 0 is not in the current range between the minimum and maximum scaling values. Select Adjust margins to major units to ensure your graph margin begins and ends on a major unit. You can also specify the width of your margin (whether the margins of the graph are extremely close to the actual data points or very far away from them). You can choose from Narrow, Medium, Wide, Extreme, Mixed, or Minimal.
- Scales in multiple graph
- Use the Scales in multiple graph drop-down box to control the display of the scales in compound graphs (such as categorized scatterplots). Select Common for each individual graph to share the same range in their axis scales (i.e., each x-axis is 0-10). Select Independent for each graph to have their own range for their axis scales (i.e., the upper-left graph's x-axis is 5-15, but the lower-right graph's x-axis is 100-200).
Scale type. Use this drop-down box to choose between five types of scaling (Linear, Logarithmic, Logit, Probability, or Weibull). Note that if the Logarithmic, Logit, Probability, or Weibull scale is selected, the scale minimum for that axis must be greater than 0.
- Shift of logarithmic scale
- When the Scale type is Logarithmic and the Mode is Manual, you can specify positive or negative shift in this text field.
- Reverse scaling
- Select this check box to reverse the scale values (technically: set the step size to a respective negative value) for the currently selected axis. When you click OK in the
Graph Options dialog box, the graph will be redrawn with the scale reversed.
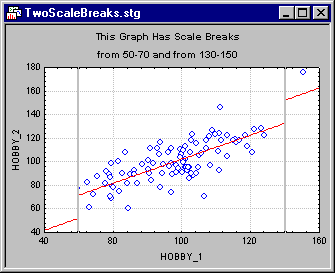
Scale break. Use the options in the Scale break group box to place one or more true scale "breaks" in a graph axis in order to "cut out" (i.e., "compress") certain areas of the graph space. Note that if the options in this box appear dimmed, click the Add new scale break button to add your first scale break.
- Add new scale break
- To add scale breaks, click this button. STATISTICA will add another number to the list box at left each time this button is clicked.
- Delete
- To delete the currently selected scale break (see the number in the list box at the far left), click this button.
- Ignore all
- Select this check box to ignore all scale breaks.
- From, To
- Specify where the scale break should begin in the From box and where it should end in the To box.
- Global scale break width
- Use the Global scale break width field to enter a global width (in points) for all of your scale breaks.
For tips on suppressing the display of a scale value on the left side (or below for vertical axes) of the break, see Suppressing Scale Values Near Scale Breaks.