Fixed Nonlinear Regression - Example
Predicting Recovery from Injury
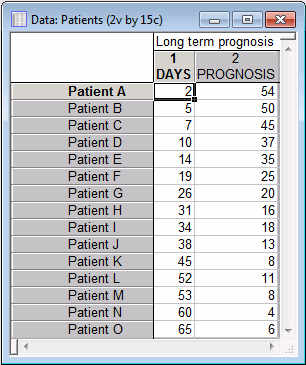
This example is based on a data set reported in Neter, Wasserman, and Kutner. Suppose a hospital administrator wants to explore the relationship between the chances for long-term recovery of severely injured patients and the number of days spent in the hospital. The data file Patients.sta contains data for 15 patients; specifically, the file contains information on the number of days that each patient was hospitalized (in the variable DAYS) and an index of the prognosis for long-term recovery for each patient (in the variable PROGNOSIS; larger values reflect a better prognosis).
You can access the file Patients.sta using the following ways:
Ribbon bar: Click the Home tab. In the File group, click the Open arrow and select Open Examples. The Open a STATISTICA Data File dialog box is displayed. Patients.sta is located in the Datasets folder.
Classic menus: From the File menu, select Open Examples to display the Open a STATISTICA Data File dialog box. Patients.sta is located in the Datasets folder.
Specifying the analysis
You can access the Fixed Nonlinear Regression module using the following ways:
Ribbon bar: Click the Statistics tab. In the Advanced/Multivariate group, click Advanced Models and from the menu, select Fixed Nonlinear Regression. The Fixed Nonlinear Regression Startup Panel dialog box is displayed.
Classic menus: In the Statistics menu click Advanced Linear/Nonlinear Models submenu, select Fixed Nonlinear Regression. The Fixed Nonlinear Regression Startup Panel dialog box is displayed.
Click Variables to display a standard Variable Selection dialog box. Select both the DAYS and PROGNOSIS variables for use in the model, and click OK.
- Click
OK to display the
Nonlinear Components Regression dialog box. You can select up to 10 transformations to be applied to each of the designated variables. Note that for the selected transformation to be successful for each transformed case, the data must be within the range specified as valid for the transformation. Nonvalid cases are eliminated from the analysis. When you click
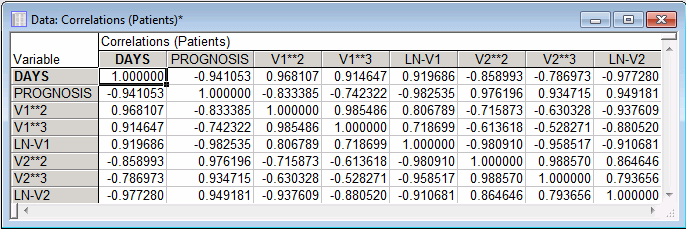
OK in this dialog box, additional variables are created in memory for each variable and transformation. For this example, select the X**2, X**3, and LN(X) check boxes.

- Click
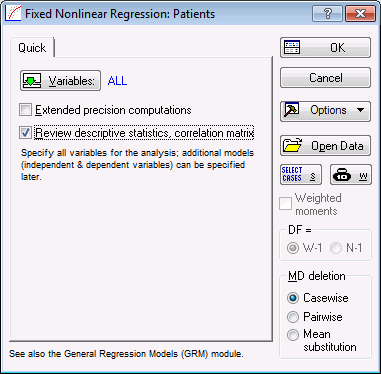
OK to display the Review Descriptive Statistics
dialog box. The summary box at the top of the dialog box indicates that the specified transformations are successfully applied to all cases in the data set.

Reviewing the transformed variables
Performing the analysis
- Click OK in the Review Descriptive Statistics dialog box to proceed with the analysis.
- On the Model Definition dialog box - Quick tab, click Variables to display a standard variable selection dialog box. Select LN-V2 from the Dependent variables list and variable DAYS from the Independent variables list, and then click the OK button.
- Click
OK in the
Model Definition dialog box to calculate the model and display the Multiple Regression Results dialog box. The model fits the data very well, with roughly 95% of the variability in prediction of LN(PROGNOSIS) explained by the model (see the adjusted R2 value in the summary box).

- Click Summary: Regression results to display a spreadsheet of model parameters and their associated statistics.
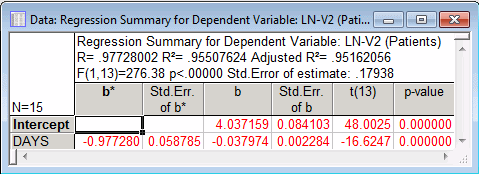
Using the B values for Intercept and DAYS from the spreadsheet, the model can be expressed as:
PROGNOSIS =exp(4.037159 - 0.037974*DAYS)
Reviewing the residual statistics
- In the Multiple Regression Results dialog box, select the Residuals/assumptions/prediction tab. Click Perform residual analysis to display the Residual Analysis dialog box.
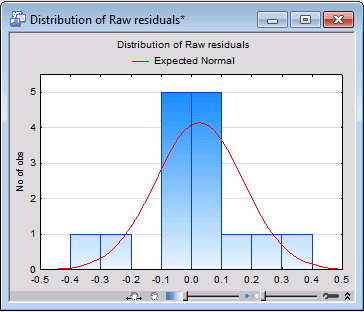
- Select the
Residuals tab. Under Type of residual, select
Raw residuals option, and click the Histogram. The resulting plot shows that the residual data, though few in number, tend to approximate a normal distribution.
- Click
Predicted vs. observed in the Residual Analysis
dialog box on the Scatterplots tab to produce a scatterplot of the predicted and observed values of the dependent variable.
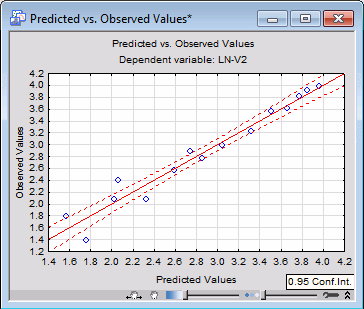
The resulting plot shows that the predictions are good in a general sense, especially for higher LN(PROGNOSIS) values. Predicting the prognosis for patients whose hospital stay was shorter is less accurate.