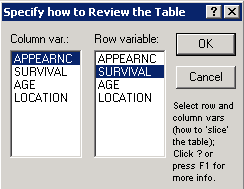
Specify How to Review the Table
Several buttons throughout the Log-Linear Analysis module lead to the Specify how to Review the Table dialog box, in which you select the two factors (row and column variables) by which to review the multi-way frequency table in the most flexible manner, slice by slice.
If there are more than two factors in the frequency table, you can view any two-way table within each of the levels of the remaining factors. A particularly useful Graph of Input Data for all tables is the 3D histogram. This graph is very helpful in order to visualize the pattern of frequencies in the table.
| Element Name | Description |
|---|---|
| Column var | In the Column var box, select the column variable by which to view the two-way table. |
| Row variable | In the Row variable box, select the row variable by which to view the two-way table. |
| OK | Click the OK button to produce the spreadsheet showing the frequencies in two-way tables, within the levels of all remaining factors. |
| Cancel | Click the Cancel button to return to the Log-Linear Model Specification dialog box. |
Copyright © 2021. Cloud Software Group, Inc. All Rights Reserved.

