Example 1 - Cox Proportional Hazards Model Survival
The data set for this example, HPAstaining.sta, is taken from Collett (2003). The data consists of survival times of breast cancer patients with tumors that were stained positively or negatively with a histochemical marker from the Roman snail known as Helix pomatia agglutinin or HPA.
Prerequisites
Open the example data file HPAstaining.sta, and start the Cox Proportional Hazards module. Following are instructions to do this from the ribbon bar and from the classic menus.
Procedure
- Click the Variables button to display the variable specification dialog box, and make the following variable selections.
-
Specify the codes for the complete and censored values. Enter a value of 1 for a complete responses and a value of 0 for a censored responses.
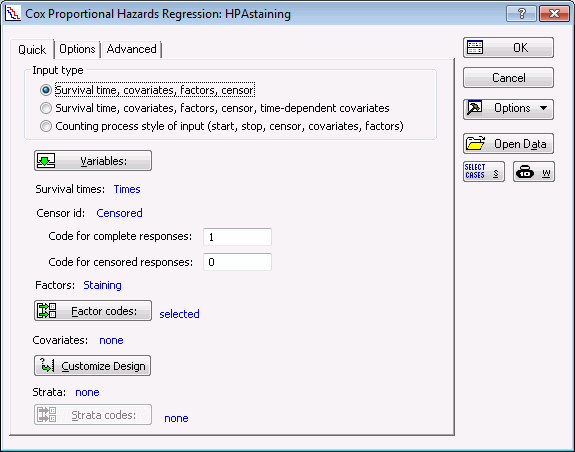
Staining is a categorical factor. Statistica provides options on how to code a categorical factor. To keep consistent with the example in Collett, we use the reference cell coding using the value of Negative as the reference; that is, the Positive value is recoded to a 1 and the Negative value are recoded to a 0.
- Click the Zoom button to display the Values/Stats dialog box, and select the value Negative.
-
On the
Quick tab, click the
Parameter estimates button to create the following spreadsheet.

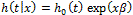
The parameter estimate is 0.908 with a standard error of approximately 0.501. Recall that the proportional hazards model assumes the following form of the hazard function:
Since the value of Positive is assigned the value of 1 and Negative is assigned the value of 0, we can compute the following ratio of the hazard functions, that is, the hazard ratio, of the Positive and Negative stained tumors as follows:
Notice that this value is provided in the output already. The value is approximately 2.48. Since this is greater than 1, we can conclude that the woman with a positively stained tumor has an increased risk of death as compared to a woman with a negatively stained tumor.
We can see this more clearly by displaying the survivor functions for the two groups.
- In the Cox Proportional Hazards Results dialog box, select the Survivor Function tab. Specify the Number of covariate patterns as 2. Click the Specify covariate values button to display the Specify covariate values dialog box. Enter the values Positive and Negative for Case 1 and Case 2 respectively.
- Since we are displaying 2 survival curves on 1 graph, in the Survivor function group box, clear the Add confidence interval check box.
- Click the Plot button.


