Example 15: A Longitudinal Factor Model
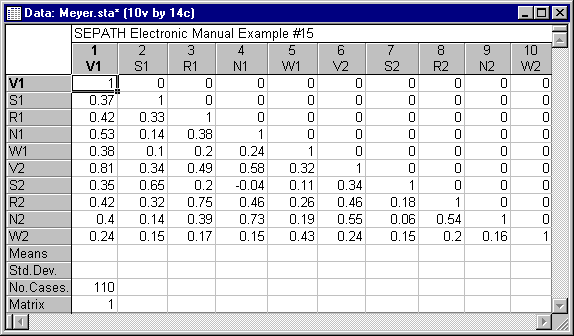
Corballis and Traub (1970) presented a longitudinal factor analysis model, which stipulates that factorial structure underlying a set of tests remains constant over two or more administrations of the tests. An example of such a model is given by Everitt (1984, pages 52-55). The data were from a study by Meyer and Bendig (1961), who administered the 5 Thurstone Primary Mental Abilities tests to 49 boys and 61 girls in grades 8 and 11. The tests are Verbal Meaning (V), Space (S), Reasoning (R), Numerical (N), and Word Fluency (W). The correlation matrix for these data is in the Meyer.sta data file.
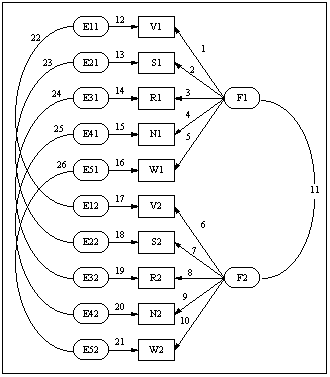
The model, analyzed by Everitt (1984) stipulates a single common factor underlying the scores on both occasions. The diagram for the model is in the figure below.
The PATH1 translation of the diagram is contained in the Meyer.cmd file.

Everitt (1984) analyzed the correlation matrix with LISREL as though it were a covariance matrix. The standard errors reported in his Table 3.10 are not correct.
The Chi-square value of 51.46 allows us to reject the null hypothesis of perfect fit. On the other hand, the noncentrality-based fit indices indicate that the jury is, in a sense, still out regarding whether the fit of this model is acceptable. Consider, for example, the Steiger-Lind RMS index. The point estimate is .076, but the confidence interval ranges from .03 to .11. Basically, this indicates that the sample size of 110 is insufficient to determine, with adequate precision, the quality of the population fit.