MQC Charts Example 3 - Computing Chart Parameters for Different Sets
- Overview
- This example demonstrates how you can base the computations of different control chart parameters on different subsets of samples and apply computed parameters to different subsets.
Let's assume that we are manufacturing plastic cover plates that have to be integrated into an instrument panel. The width and the length (measured in millimeters) are important quality characteristics since the cover has to fit into a predefined frame.
We will use the Cover.sta data file, and create a Hotelling’s T2 chart to monitor both quality characteristics.
Specifying the analysis.
- Ribbon bar
- Open the data file by selecting the Home tab. In the File group, click the Open arrow and select Open Examples to display the Open a Statistica Data File dialog. The data file is located in the Datasets folder.
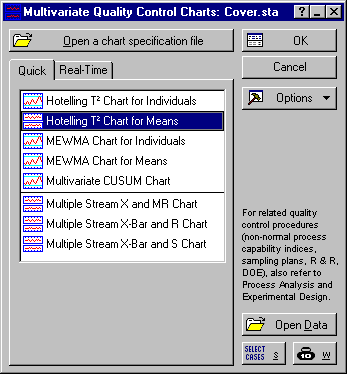
Then, select the Statistics tab. In the Industrial Statistics group, click Multivariate to display the Multivariate Quality Control Charts Startup Panel.
- Classic menus
- Open the data file by selecting Open Examples from the File menu to display the Open a Statistica Data File dialog. The data file is located in the Datasets folder.
Then, from the Statistics - Industrial Statistics & Six Sigma submenu, select Multivariate Quality Control to display the Multivariate Quality Control Charts Startup Panel.
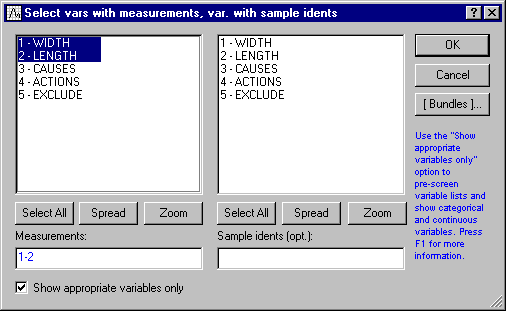
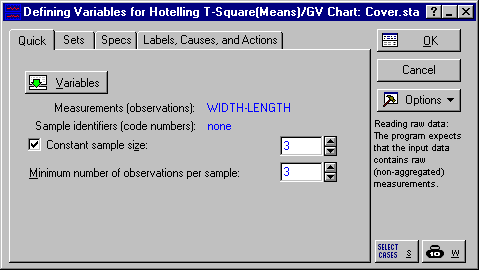
Select Hotelling T2 Chart for Means on the Quick tab. Click the OK button to display the Defining Variables for HotellingT-Square(Means)/GV Chart dialog. On the Quick tab, click the Variables button, and in the variable selection dialog, select Width and Length as the Measurements.
Click the OK button. Select a value of 3 as the Constant sample size and as the Minimum number of observations per sample.
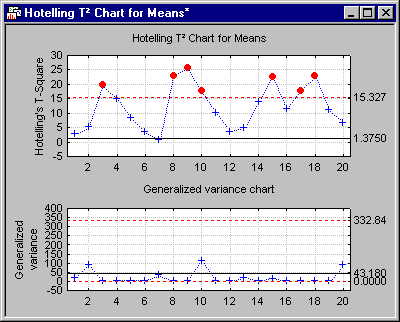
Then click OK to produce the chart.
You will notice that, although the Generalized variance chart seems to be in control, there are many outliers in the Hotelling T2 chart that need to be further examined.
- Setting up different sets
- Let's assume that we know for sure that the process was in control in the first ten samples. Beginning with sample 11, a machine was replaced by a newer model. Therefore, we want to specify two separate sets and perform the computation of the control chart parameters for each set independently (and determine whether the process might have shifted). The first set contains samples 1 - 10; the second set contains samples 11 - 20.
In the Hotelling T2 for Means results dialog, select the Sets tab and click the Make-a-new-set Wizard button. In the Label (name) for the new set of samples? dialog, label the new set In control and click the Next button.
In the Compute the set from ranges or codes? dialog, make sure that the Range of consecutive samples option button is selected under Compute statistics from and click Next.
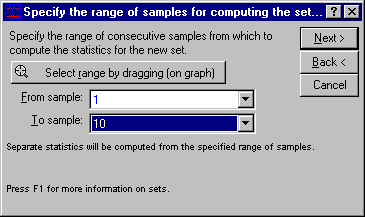
In the Specify the range of samples for computing the set dialog, specify the samples number 1 and 10 in the drop-down boxes From sample and To sample. Note that you could also click the Select range by dragging (on graph) button in order to select the range of samples in the brushing mode.
Click Next, and in the Apply the set statistics and specifications to range dialog, choose the Range of consecutive samples option button under Apply statistics and specifications to and click Next.
In the Specify the application range for the set dialog, select samples 1 to samples 10 in the drop-down boxes From sample and To sample. Then click Finish.
Specify a second set labeled New machine by using the procedure described above and selecting samples 11 to 20.
Now, select the Charts tab in the Results dialog, and click the Charts button.
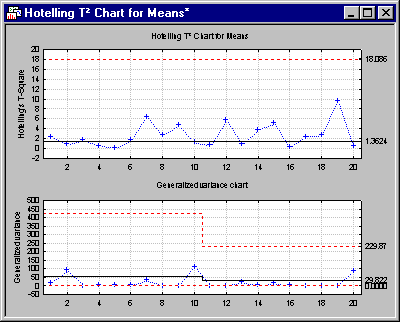
Notice that all the points in the Hotelling’s T2 chart are now within the upper control limit. Once the new machine has been accounted for, the points now exhibit only common cause variation.

