Neural Network Training in Progress
You can click the Train button in either the SANN - Automated Network Search (ANS) dialog box or the SANN - Custom Neural Network dialog box to display the Neural network training in progress dialog box while the networks are built.
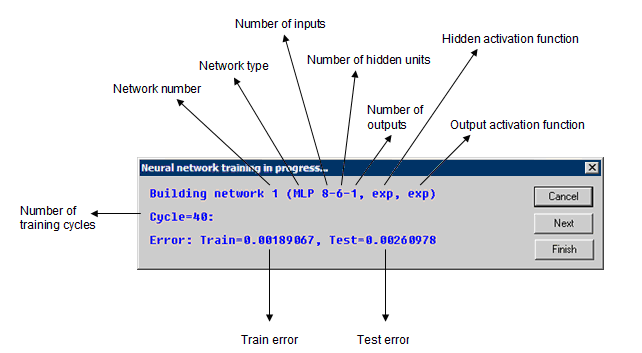
This dialog box provides summary details about the networks being built including the type of network (MLP, RBF or SOFM), the hidden and output activation functions, the training cycle, and the appropriate error terms. For regression tasks, the error term is the average of sum-of-squares error for the network for the train and test (if selected) samples; for classification tasks, the error is the classification rate (that is, the percentage of correctly classified cases for train and test samples).
In addition to the above, the Neural network training in progress dialog box can also display one or more real time training graphs depending on the options you have selected on the Real time training graph tab. To display the real time training graph, select the Display real time training graph for check box. Then select Train error and/or Test error depending on which type of error graph you want to include in the real time graph.
| Option | Description |
|---|---|
| Cancel | Quits the training process. |
| Next | Ends training the current network and advance to another one. |
| Finish | You can click this button at any point during training to prematurely finish training. The network under training is discarded and the rest (those trained so far) are retained. The winning networks are selected from those so-far generated, and the SANN - Results dialog box is displayed. |
| Training progress dialog information area | Displays some information which informs the user as to what kind of networks have been created, how many so far, and how the training is progressing forward. |
| Network name and architecture | Each model has a name depending on its type, either MLP (Multilayer Perceptron), RBF (Radial Basis Functions) or SOFM (Self Organizing Feature Maps), number of inputs, number of neurons in the hidden layer, and the number of outputs. For example, the model name 2 MLP 1-2-1 indicates a multilayer perceptron network with 1 input, 2 neurons in each layer, and 1 output. The number 2 before the model name indicates it is the second network that is been trained (this tells the user how many more models remains to be trained). The progress dialog box also displays the nature of the activation functions used by the network. |
| Train and Test Errors | The training progress dialog also displays information that provides an indication of how training is progressing. The nature of the information displayed depends on the task at hand. For regression problems, the information consists of the sum of squares error for the train and test (if selected) samples. Note that these errors are computed for the original (unscaled) value of the targets. For classification tasks, the information displayed is the misclassification rate (proportion of cases wrongly classified is easy to interpret since it assumes values between 0% and 100% with 0% being the best since it means zero misclassification. Like regression problems, the information displayed for cluster analysis is the error of the SOFM Kohonen network, which is a measure of the distance of the individual cells from the train and test (if selected) inputs (scaled from 0 to 1). |
The preceding information provides a general indication of how training is progressing. If the error in a regression problem (or the misclassification rate in a classification problem) does not change, it is an indication that a solution is found (though not necessarily a good one), and soon SANN stops training the neural network. Alternatively, if the error decreases, then an optimal or suboptimal solution is still to be found. An increasing train error means that the algorithm has passed beyond the optimal point and may be about to diverge (at which point SANN restores the best previous network). A decreasing train error coupled with an increasing test error simply indicates that the network is overfitting the data, which may yield a poor generalization ability (again, SANN restores the best previous network).

