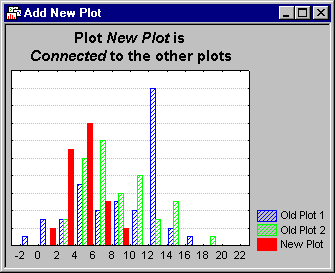
New Plot(s)
Clicking the Add new plot button in the Graph Options dialog box - Plot: General tab is one way to display the New Plot(s) dialog box. Use these options to add new plots to the current graph, for example, to add a new scatterplot to the current graph. The availability and nature of some of the options on this dialog will depend on the type of graph to which you want to add a plot.
- Type
- The graph types available in the Type drop-down box will depend on the graph type to which you want to add a plot. For example, for simple 2D scatterplots you can add additional scatterplots, line plots, probability plots, etc.
- OK
- Click the OK button to display the Graph Data Editor, which is used to enter (or paste in from the Clipboard) the data for the new plot. Note that the respective graph will be updated interactively, as you enter the data into the Graph Data Editor.
- Name
- Type the name of the plot in the Name box; the name will not appear on the graph itself (by default); however, various options in the Graph Options dialog box will refer to this name when displaying the settings relevant to this plot (and accessible from the respective dialog or dialog tab).
- Cancel
- Click the Cancel button to close this dialog box, disregarding any changes you have made.
- No. of plots.
- Enter the number of plots to add in the No. of plots field.
- Connect to current plot's settings
- Select the Connect to current plot's settings check box in order for new plot(s) to share various "settings" with the current plot (i.e., the current plot as shown in the Graph Options dialog box from which this dialog box was called). The term "settings" here refers to various aspects of the manner in which the plot is computed from the data, and the specific nature of the settings that are copied depends on the current type of plot, as well as the Type of plot chosen on this dialog. The general purpose of this option is to integrate the data for the new plot(s) into the existing graph in the most "meaningful" manner, applying the same general layout. When this is not possible, this option will be dimmed.
For example, suppose your current plot is a multiple histogram, where the columns for different variables for identical categories are displayed side-by-side. If you add another histogram plot (add a plot of type Histogram), and select the Connect to current plot's setting check box, then the data typed into the Graph Data Editor will be rendered in the graph as additional columns, displayed next to all other columns.
If you do not select the Connect to current plot's settings check box, the new histogram will be displayed like a stand-alone default histogram.
Similarly, if you select this check box and add new box-whisker plots, normal probability plots, etc., the respective settings that define the plot (and, "integrate" the data for the new plot in the most meaningful manner into the existing graph) will be applied to the new data.
- No. of points.
- Enter the number of points to add to the new plot in the No. of points field; note that you can later change this dynamically, by just adding data (more than No. of points) into the Graph Data Editor.
- No. of variables.
- The No. of variables field is only available if there are different (multiple) numbers of columns that can be filled with data to define the new plot. For example, in box-whiskers plots, you can simply add 1 column with data values, to add a single box-whisker icon to the graph, or you could request multiple variables (for the same plot) in this field to add multiple box-whiskers to the graph.
- Weight
- Select the Weight check box to make room in the new plot for an additional weight variable; the data entered into the weight variable will be used when and where appropriate, given the respective plot.


