Gage Repeatability & Reproducibility Results - Gage Performance Tab
Select the Gage performance tab of the Gage Repeatability & Reproducibility Results dialog box to access the options described here.
Use the options on this tab to compute gage performance curves, and estimate (display) the misclassification risk given your 1) measurement system and 2) upper and lower specification limits (beyond which a part or item would be rejected). The computations on this tab are also described in the ASQC/AIAG Measurement Systems Reference Manual (2002).
- Gage performance
- Click the
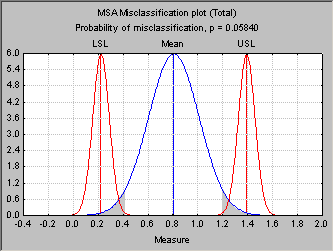
Gage Performance button to display summary gage performance curves. These curves describe the probability of an item to be erroneously misclassified as falling outside the Lower specification limit and Upper specification limit, given the Part-to-Part variability, or Total Measurement System variability (2 graphs are typically produced), as estimated and reported in the Variance components spreadsheet, which is also created.
The graph shows a normal distribution centered over the respective mean for this study. The standard deviation of this curve is determined either from the Total variability, or the Part-to-Part variability (as indicated at the top of the graph).
The two normal curves over the Lower specification limit and the Upper specification limit (LSL and USL respectively) represent the measurement variability (combined R&R) around these limits. The grey area indicates the reasonable risk that an item will be erroneously misclassified as acceptable (inside the USL-LSL range), when in fact it is not, i.e., when the item actually came from a distribution centered over the respective limit (LSL, USL), and specifically, falls within the area defined by ±3 time sigma (measurement variability) around the respective limit. That probability is reported at the top of the chart.
- Lower specification limit
- Usually, engineering requirements dictate a range of acceptable values. Enter the lower specification limit in this field, or use the microscrolls to adjust the limit. This should specify the lower limits for the gage performance curve computations described above.
- Upper specification limit
- Usually, engineering requirements dictate a range of acceptable values. Enter the upper specification limit in this field, or use the microscrolls to adjust the limit. This should specify the upper limits for the gage performance curve computations described above.

