MQC Charts Example 1 - Creating a Hotelling's T2 Chart
- Overview
- This example is based on the data file IndustrialEvaporator.sta. The data contains details of the process of drying a fixed quantity of a wet product placed in an evaporator bed. During the evaporation process, 8 variables - Dewpoint, Intake Temp, In-Process Air Temp, Exhaust Temp, Mass Air Flow, Bed Temp, Filter Pressure, and Bed Pressure - were measured between regular time intervals for monitoring and quality control.
This example uses the IndustrialEvaporator.sta data set to demonstrate the use of Statistica Multivariate Quality Control to monitor the evolution of the evaporation process of a wet product in order to detect abnormal conditions if they arise and to ensure the quality of the end product.
Specifying the analysis.
- Ribbon bar
- Open the data file by selecting the Home tab. In the File group, click the Open arrow and select Open Examples to display the Open a Statistica Data File dialog. The data file is located in the Datasets folder.
Then, select the Statistics tab. In the Industrial Statistics group, click Multivariate to display the Multivariate Quality Control Charts Startup Panel.
- Classic menus
- Open the data file by selecting Open Examples from the File menu to display the Open a Statistica Data File dialog. The data file is located in the Datasets folder.
Then, from the Statistics - Industrial Statistics & Six Sigma submenu, select Multivariate Quality Control to display the Multivariate Quality Control Charts Startup Panel.
Select Hotelling T2 Chart for Individuals on the Quick tab. Click the OK button to display the Defining Variables for Hotelling T-Square(Individuals) Chart dialog. On the Quick tab, click the Variables button and select variables 1-8.
Click the OK to close the variable selection dialog. Next, on the Defining Variables for Hotelling T-Square(Individuals) Chart dialog, select the Advanced tab. Specify Sample Covariance Matrix as the method of estimating the covariance matrix.
Click OK to run the analysis. The Hotelling T2 Chart for Individuals will be displayed, as well as the Results dialog.
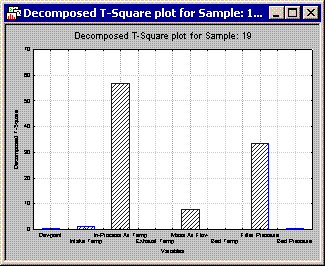
From the control chart samples, 17, 18, 19, and 22 are out of control. In order to quickly look at which variables are important in influencing each those points, select the Brushing tab of the Results dialog. Next, select the All out-of-control samples options button. Then, click the Partial T2 button.
This will create one graph for each outlying data point. Each graph displays the decomposed T2 statistic for each variable. A larger value indicates a more influential or important variable. For example, the variables In-Process Air Temp and Filter Pressure are influential variables for sample 19. If you look back at the original data set for sample 19, you will see the value for In-Process Air Temp is more than 4.5 standard deviations below the mean, and the value for Filter Pressure is just above 3 standard deviations from the mean.


