Example 6: Latin Square Designs
Latin square designs are discussed in the Introductory Overview. The design of Latin squares proceeds basically analogously to that of the other designs presented in the previous two examples with a few exceptions that should be self-explanatory. Therefore, the analysis of a Latin square study, specifically the one on the fuel-additives study discussed in the Introductory Overview (from Box, Hunter, and Hunter, 1978, page 247), will be presented in this example.
Open the Latin.sta data file and start Experimental Design.
Ribbon bar. Select the Home tab. In the File group, click the Open arrow and from the menu, select Open Examples to display the Open a Statistica Data File dialog box. Double-click the Datasets folder, and open the Latin.sta data set. Then, select the Statistics tab, and in the Industrial Statistics group, click DOE to display the Design & Analysis of Experiments dialog box.
Classic menus. On the File menu, select Open Examples to display the Open a Statistica Data File dialog box. The Latin.sta data file is located in the Datasets folder. Then, on the Statistics - Industrial Statistics & Six Sigma submenu, select Experimental Design (DOE) to display the Design & Analysis of Experiments dialog box.
- Specifying the Design
- In the Startup Panel, select the
Advanced tab. Select Latin squares, Greco-Latin squares, and click the OK button.
In the Design & Analysis of Latin Square Experiments dialog box, select the Analyze design tab. The design of the fuel-additives study consists of a 4-level Latin square design with the three factors (fuel additive, car, and driver), and the dependent variable is the reduction in oxides of nitrogen. Therefore, click the Variables button and select Reductin as the Dependent variable and Driver, Car, and Additive as the Independent vars (factors). Click the OK button.
- Reviewing Results
- Now, click OK to display the Analysis of a Latin Square Experiment dialog box.
- Marginal means
- First, click the Marginal means button to review the marginal means.
The third column in the spreadsheet contains the parameter estimates, that is, in this case the deviations of the mean of the respective factor level from the overall mean (μ). As you can see, additive A_Two produced the largest reduction among all of the additive types tested. These results can be easily plotted by returning to the results dialog box and clicking the Means plot button.
Again, additive A_Two (in the right-most plot) seems to produce the greatest reduction in oxides of nitrogen among all additives tested.
- Analysis of variance
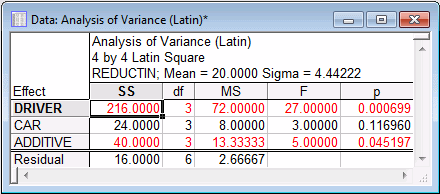
- Finally, you can evaluate the statistical significance of the effect of the fuel additives by clicking the Summary: Analysis of variance button.
The results indicate that the effect of the fuel additive on the reduction of oxides of nitrogen is significant.
See also, Experimental Design Index.


