How can I record a Master Macro (Log of Analyses)?
In a Master Macro, several consecutive and simultaneous analyses can be recorded (e.g., an analysis via Multiple Regression, followed by an analysis of the prediction residuals via Basic Statistics); also, most data management operations are recorded. Refer to How can I record my analysis in an SVB program? to learn about the differences between Analysis Macros, Master Macros, and Keyboard Macros; see also What exactly is recorded in a master macro?.
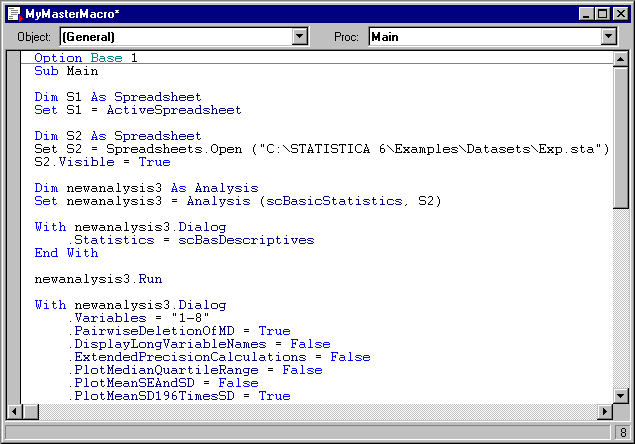
Here is an example of how you can record a Statistica Visual Basic Master Macro program - to create a complete log of all analyses from the point when you explicitly begin the Master Macro recording to the point when you terminate the recording. Remember that in Master Macros, basically all actions are recorded, including the specific datafile that is used for the analysis. Start Statistica and start the recording of the Master Macro by selecting Start Recording Log of Analysis (Master Macro) from the Tools - Macro menu; you will see the floating Record toolbar as a reminder that a recording "session" is in progress. Next, open the example datafile Exp.Sta. Select Basic Statistics from the Statistics menu. Click the OK button, and on the Descriptive Statistics dialog, click the Variables button and select all variables; then click the Summary button to produce the results spreadsheet. Next click the stop button
![]() on the floating Record toolbar or select Stop Recording from the Tools - Macro menu, to create the SVB program of this analysis.
on the floating Record toolbar or select Stop Recording from the Tools - Macro menu, to create the SVB program of this analysis.
Note that, unlike in the Analysis Macro, in this case the opening of the input datafile for the analysis was explicitly recorded. If you run this program, the identical analysis is performed, i.e., the macro program will create a summary results spreadsheet with descriptive statistics for variables 1 through 8 from datafile Exp.sta.
To reiterate, Master Macro recordings will record entire sequences of analyses, including the selection of various global (e.g., output) options, etc. You can even record a macro of sequential analyses where some analysis is performed on a results spreadsheet created by a preceding analysis (e.g., make some custom Scatter Icon Plots for residuals computed by Multiple Regression).

