Goodness of Fit Computational Details
The Goodness of Fit module will compute various statistics for continuous and categorical variables (regression and classification problems) that reflect the quality or accuracy of the prediction or predicted classification. See also the Overview for details.
Note on computations. In this module, casewise deletion of missing data is used to process the data. This may cause different results if you select different variables. For example, if you calculate goodness of fit statistics for Y, X1 and X2, then recalculate those statistics for Y, X1, X2 and X3, when X3 has missing data, the results will be different. If all cases are deleted by the casewise deletion method, an error message will be issued and the analysis will stop. Additionally, if a selected variable has no variance and correlation coefficient statistics have been selected, an error message will be issued and the analysis will stop.
- Continuous variables
- For continuous variables (regression problems), the following statistics are computed:
Least squares deviation (LSD), mean square error
N - Number of observations or sum of weights
E i - Predicted value of case i
O i - Observed value of case i
Average deviation, mean absolute error
N - Number of observations or sum of weights
E i - Predicted value of case i
O i - Observed value of case i
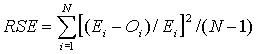
Relative squared error, mean relative squared error
N - Number of observations or sum of weights
E i - Predicted value of case i
O i - Observed value of case i
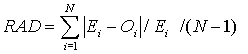
Relative absolute deviation, mean relative absolute error
N - Number of observations or sum of weights
E i - Predicted value of case i
O i - Observed value of case i
Correlation coefficient (Pearson product moment correlation)
N - Number of observations or sum of weights
E i - Predicted value of case i
O i - Observed value of case i
- Categorical variables
- For categorical variables (classification problems), the following statistics are computed:
Pearson Chi-square
N - Number of observed classes
E i - Number of observations in observed class i that are predicted to belong to class i (predicted or expected frequencies for observed class i)
O i - Number of observations belonging to class i (observed frequencies)
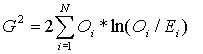
Note: this value will become 0 (zero) when the classifier is perfect (i.e., when the expected classifications are identical to the observed classifications).G-square (maximum likelihood Chi-square)
N - Number of observed classes
E i - Number of observations in observed class i that are predicted to belong to class i (predicted or expected frequencies for observed class i)
O i - Number of observations belonging to class i (observed frequencies)
Percent disagreement (misclassification rate)
The percent disagreement measure is computed as the percent of observations for which the expected classifications are not equal to (disagree with) the observed classifications.