Macro (SVB) Programs Example - Creating and Customizing Graph Objects
These examples demonstrate how to create an empty graph, set data into the graph, and then add various customizations.
- Creating a blank graph
- Let's begin by creating a simple graph object. Create a new
macro program and enter (or copy and paste) the program instructions shown below:
Option Base 1
Sub Main
Dim g As New Graph
g.Visible = True
End Sub
At this point, variable g will hold the graph; however, there is no content (nor content area), so the next thing to do is to create a graph object to hold any data, customizations, etc.
We have now created a blank 2D graph and have the object with all its properties and methods in variable go. As mentioned in various places throughout this documentation, to quickly review the object model for graphs, you can display the Object Browser and select the StatisticaGraphics library.
- Setting data into the graph
- Next, let's set data into the blank graph. To do so, type in the following program:
Option Base 1
Sub Main
Dim g As New Graph
Dim go As GraphObject
Set go=g.GraphObject
go.CreateContent(scg2DGraph)
' Create data:
' Henon Strange Attractor; see Welstead, 1994, Neural Networks.
Dim Size As Long Size = 10000
ReDim h1(Size) As Double, h2(Size) As Double Dim hh1 As Double, hh2 As Double
hh1 = 0
hh2 = 0
For i=1 To Size
h1(i)=1 + hh2 - 0.1*hh1*hh1
h2(i)=.9998*hh1 hh1=h1(i)
hh2=h2(i)
Next i
' Now set the data in the 2D Graph, as a scatterplot:
' First add a plot:
Dim l2 As Layout2D
Set l2 = go.Content
' Variable l2 contains the 2D Layout object; next
' retrieve the plots in the current graph.
Dim ps As Plots2D Set ps = l2.Plots
' Create a new 2D simple plot via the Add method.
Dim p2d As Plot2D Set p2d = ps.Add(scgSimplePlot,Size)
' Now retrieve the variables in the first plot, i.e. the one
' we just created.
Dim Vx As Variable, Vy As Variable
Set Vx = p2d.Variable(1)
Set Vy = p2d.Variable(2)
' Finally, set the new values.
For i = 1 To SizeVx.Value(i) = h1(i)
Vy.Value(i) = h2(i)
Next i
' Make the graph visible g.Visible = True
End Sub
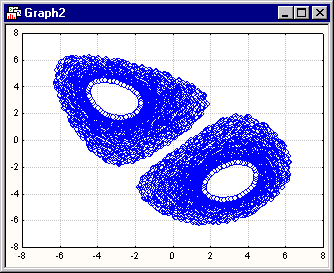
Here is the graph that will be created:
- Adding a title to the graph
- Next, let's write a subroutine to add a title to the graph. To do so, right before the statement g.Visible = True add a call to a new subroutine, and define the subroutine as shown below:
SetTitleOfMyGraph g,"Henon Strange Attractor", "Arial Black", 15
g.Visible = True
End Sub
Sub SetTitleOfMyGraph(g As Graph,MyTitle As String, _ FontName As String, FontSize As Long)
Dim t As Titles Set t = g.Titles
Dim t1 As Title
'Create a new main title.
Set t1 = t.Add(scgMainTitle,MyTitle)
t1.Font.Size = FontSize
t1.Font.FaceName = FontName
End Sub
Note how we not only have created a title,
but also modified the default font and font size for the title.
Also, for illustration purposes,
this code could be written much more "densely" by not explicitly defining the respective objects;
so an alternate way to write this routine would be:
Sub SetTitleOfMyGraph(g As Graph,MyTitle As String, _ FontName As String, FontSize As Long)
g.Titles.Add(scgMainTitle,MyTitle)
g.Titles.Item(1).Font.Size = FontSize
g.Titles.Item(1).Font.FaceName = FontName
End Sub
- Changing the scales
- You can now add the following code (subroutines) to change the scaling for the axes and the font that is used for the axis labels. Again, before the statement g.Visible=True add the calls to the functions as shown below:
ChangeAxisScaling l2.Axes.XAxis, -8.0, 1.0, 8.0, _
"Arial Black", 12
ChangeAxisScaling l2.Axes.YAxis, -8.0, 1.0, 8.0, _ "Arial Black",
12g.Visible=True
End Sub
Sub ChangeAxisScaling (x As Axis2D, _ xmin As Double, xstep As Double, xmax As Double, _ FontName As String,
FontSize As Long)
x.RangeMode = scgManualRange
x.SetManualRange(xmin,xmax)
x.StepMode = scgManualStep
x.StepSize = xstep
x.Font.Size = FontSize
x.Font.Face.FaceName = FontName
End Sub
Extra objects - adding custom text.
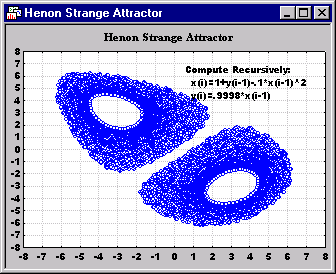
Next, let's write a subroutine to add a brief description of what is being plotted as a custom text.
Again, we will make a subroutine, this time to place some custom text in a particular location in the graph.
AddCustomTextToMyGraph g, _ "Compute Recursively:" + vbCrLf + _
"  x(i)=1+y(i-1)-.1*x(i-1)^2" + vbCrLf + _
"  y(i)=.9998*x(i-1) ", _ 7, 7,
"Arial Black", 12g.Visible=True
End Sub
Sub Add
CustomTextToMyGraph ( g As Graph, _ t As String, x As Double, y As Double, _ FontName As String, FontSize As Long)
Dim tob As TextObject
Set tob = g.ExtraObjects.AddDynamicText(t,x,y)
tob.Parameters.AnchorPosition=2 tob.Text.Font.FaceName = FontName
tob.Text.Font.Size = FontSize
End Sub
Depending on your current system defaults, the final graph will look like this:
Note: the Graph.ExtraObjects object contains methods to add not only text but also (poly-) lines, arrows, shapes, and other graphs, i.e., to embed those custom (extra-) objects into your graph. Each object has an index (displayed on the object properties dialog title bar) that can be referenced in SVB. Thus, the Statistica graphics library provides a comprehensive tool to build highly customized graphical displays.For example, if a graph has 2 added shape objects (e.g., a circle and a rectangle), the following code will increase the line thickness of the second object.
Sub Main
Dim oG As GraphSet
oG = ActiveGraphExDim
oS As ShapeObjectSet
oS = oG.ExtraObjects.Item(2)
oS.Line.Weight = oS.Line.Weight*2
End Sub


