Conceptual Overviews - Probability-Probability Plots
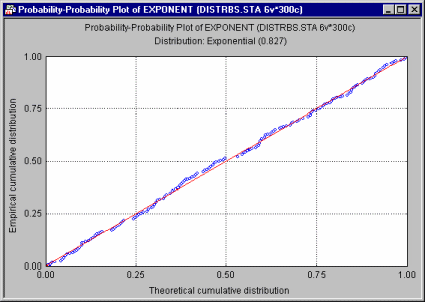
The Probability-Probability (or P-P) plot is useful for determining how well a specific theoretical distribution fits the observed data. In the P-P plot, the observed cumulative distribution function (the proportion of non-missing values <= x) is plotted against a theoretical cumulative distribution function in order to assess the fit of the theoretical distribution to the observed data. If all points in this plot fall onto a diagonal line (with intercept 0 and slope 1), then you can conclude that the theoretical cumulative distribution adequately approximates the observed distribution.

If the data points do not all fall on the diagonal line, then you can use this plot to visually assess where the data do and do not follow the distribution (e.g., if the points form an S shape along the diagonal line, then the data may need to be transformed in order to bring them to the desired distribution pattern).
In order to create this plot, the theoretical distribution function must be completely specified. Therefore, the parameters for the distribution must either be defined by the user or computed from the data (see the specified distribution for more information on the respective parameters).
In general, if the observed points follow the selected distribution with the respective parameters, then they will fall onto the straight line in the P-P plot.
