| Variables
|
Click the
Variables button to display a
standard variable selection
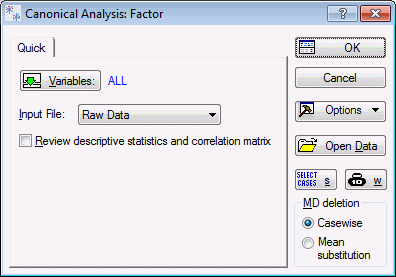
dialog box, in which you select the variables that will be used in the canonical analysis. Only variables that are selected at this point will be available later for the specification of the canonical correlation. A correlation matrix will be calculated for all variables that are selected in this dialog.
|
| Input File
|
This option contains two selections:
Raw Data and
Correlation Matrix.
- Raw Data: If you select Raw Data, Statistica expects a standard raw data file as input.
- Correlation Matrix: If you select
Correlation Matrix, Statistica expects a correlation matrix as input. Correlation matrix files can be created from within various other modules (for example, Basic Statistics, Factor Analysis, Multiple Regression.), or they can be created directly via the Create New Document dialog box - Spreadsheet tab (see also, Matrix File Format). Note that if your Input File consists of correlation coefficients only (e.g., from a published source), and no means, standard deviations, or N is available, you may simply assume standardized data (mean = 0, standard deviation = 1) and an N of, for example, 100 (N must be greater than the number of variables in the analysis). You will first need to add these four cases (means, standard deviation, cases, and matrix) to your spreadsheet before you can run the analysis. Of course, in the results, the descriptive statistics for each variable are not meaningful in that case, however, the canonical analysis can be performed based on the correlation coefficients alone.
|
| Review descriptive statistics and correlation matrix
|
Select this check box to display the
Review Descriptive Statistics dialog box after you click the
OK button. In the
Review Descriptive Statistics dialog box, detailed descriptive statistics for the selected variables are displayed. Click
OK in the
Review Descriptive Statistics dialog box to continue the analysis and display the
Model Definition dialog box.
|
| OK
|
Click the
OK button to display either the standard variable selection dialog box or the Model Definition dialog box (if you have already selected variables via the Quick tab).
|
| Cancel
|
Click the
Cancel button to close the Startup Panel without performing any analysis.
|
| Options
|
See Options Menu for descriptions of the commands on this menu.
|
| Open Data
|
Click the
Open Data button to display the Select Data Source dialog box, which is used to choose the spreadsheet on which to perform the analysis. The Select Data Source dialog box contains a list of the spreadsheets that are currently active.
|
| Select Cases
|
Click the
Select Cases button to display the Analysis/Graph Case Selection Conditions dialog box, which is used to create conditions for which cases will be included (or excluded) in the current analysis. More information is available in the case selection conditions overview, syntax summary, and dialog box description.
|
| W
|
Click the
W (Weight) button to display the Analysis/Graph Case Weights dialog box, which is used to adjust the contribution of individual cases to the outcome of the current analysis by "weighting" those cases in proportion to the values of a selected variable.
|
| MD deletion
|
The MD deletion options are active only if Raw Data has been specified as the Input file (see Canonical Analysis Startup Panel - Quick tab). Missing data (MD) can be deleted Casewise or by Means Substitution depending on the option specified here.
- Casewise: If this option button is selected, only cases that do not contain any missing data for any of the variables selected for the analysis will be included in the analysis.
- Mean substitution: If this option button is selected, missing data will be replaced by the means for the respective variables (for this analysis only, not in the data file).
|

