Example 6: Attribute Agreement Analysis
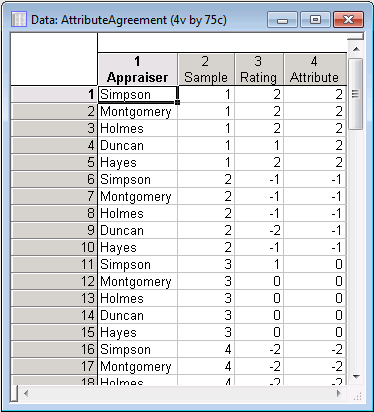
Ribbon Bar. Select the Home tab. In the File group, click the Open arrow and on the menu, select Open Examples to display the Open a Statistica Data File dialog box. Open the AttributeAgreement.sta data file, which is located in the Datasets folder.
Classic menus. On the File menu, select Open Examples to display the Open a Statistica Data File dialog box. Open the AttributeAgreement.sta data file, which is located in the Datasets folder.
- Specifying the analysis
- Start the
Process Analysis module:
Ribbon bar. Select the Statistics tab. In the Industrial Statistics group, click Process Analysis to display the Process Analysis Procedures Startup Panel.
Classic menus. On the Statistics - Industrial Statistics & Six Sigma submenu, select Process Analysis to display the Process Analysis Procedures Startup Panel.
Select Attribute agreement analysis.
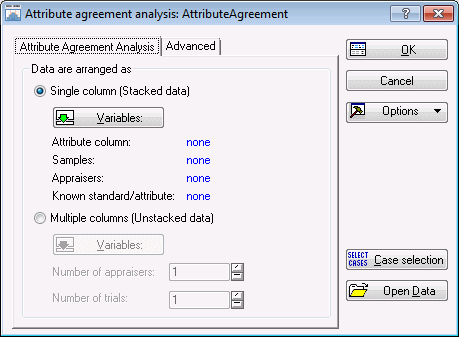
Click the OK button to display the Attribute agreement analysis dialog box.
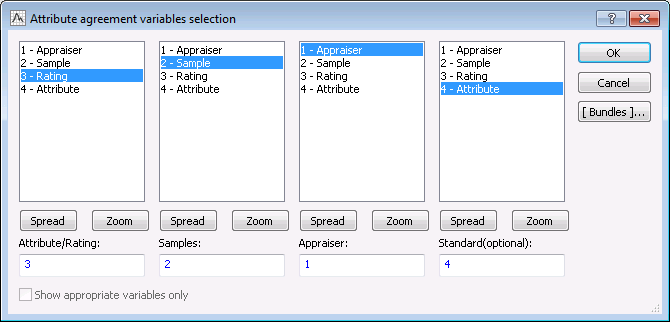
Click the Variables button, and in the variable selection dialog box, select Rating as the Attribute/Rating variable, Sample as the Samples variable, Appraiser as the Appraiser variable, and Attribute as the Standard(optional) variable.
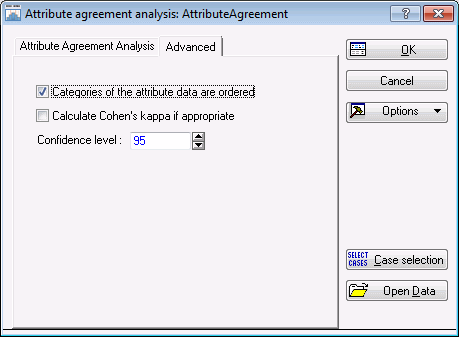
Click OK in the variable selection dialog box. In the Attribute agreement analysis dialog box, select the Advanced tab. Since the data are ordered, select the Categories of the attribute data are ordered check box.
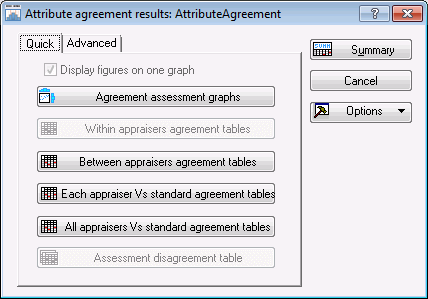
Click OK to run the analysis and display the Attribute agreement results dialog box.
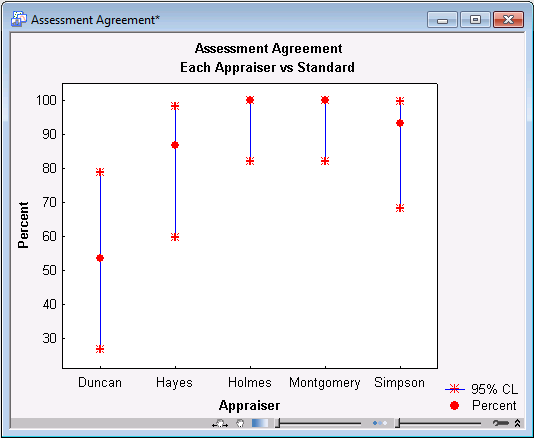
Click the Agreement assessment graphs button to create a graph showing the percent of agreement for each appraiser with the standard and associated 95% confidence intervals.
Duncan only agreed with the standard about 53% of the time. Hayes did much better with about 87% agreement. Simpson agreed about 93%, and Holmes and Montgomery agreed with the standard on all essays. From this graph it appears that Duncan, Hayes, and Simpson require further training.
In addition to the graph, there are three spreadsheets available for further review:
1) Between appraisers agreement tables
2) Each appraiser vs standard agreement tables
3) All appraisers vs standard agreement tables
Click the Between appraisers agreement tables button to produce the following spreadsheet.
This table displays how well the appraisers agreed with one another. As you can see, the appraisers agreed 40% (6 out of 15) of the time. In addition to the percentage of agreement, Statistica also displays Fleiss’ Kappa Statistics and Kendall’s Coefficient of Concordance. The Fleiss’ Kappa Statistics show how well the appraisers agreed for each standard response. A value close to 1 indicates strong agreement. Kendall’s Coefficient of Concordance indicates the strength of relationship among the appraisers. This value ranges from -1 to 1. A value near 1 indicates strong agreement. Both of these measures indicate a fairly strong agreement among appraisers.
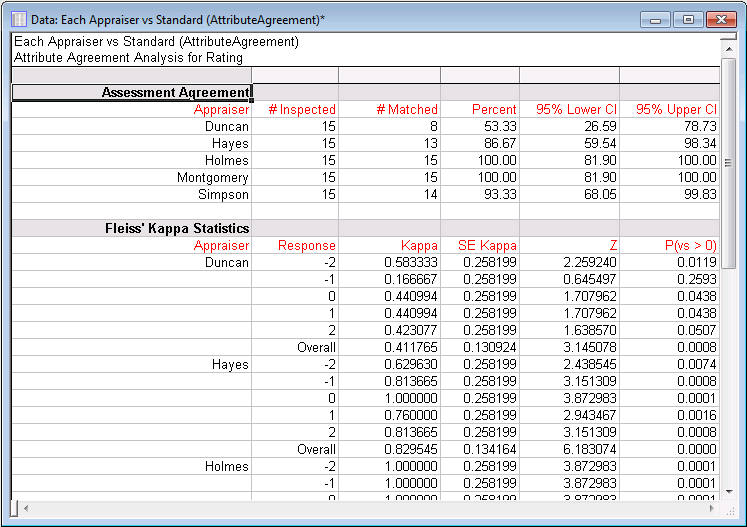
Next, click the Each appraiser Vs standard agreement tables button to produce the following spreadsheet (partial image below).
The table displays information on how well each appraiser agreed with the standard. Fleiss’ Kappa Statistics are also provided.
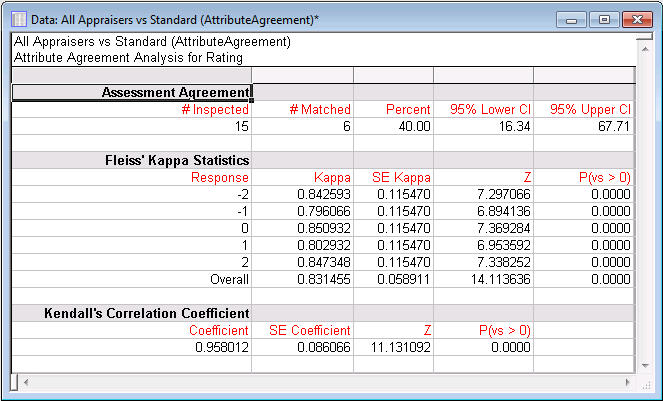
Finally, click the All appraisers Vs standard agreement tables button to produce the following spreadsheet.
This spreadsheet indicates how well all the appraisers agreed with the standard. The Fleiss’ Kappa Statistics and Kendall’s Coefficient of Concordance both indicate fairly good agreement among the appraisers and the standard.

