Brushing 2D/3D - Interactive Tab
Select the Interactive tab of the Brushing 2D/3D dialog box to access options to brush data points on your graph. All options in this dialog box are common to 2D and 3D graphs except the two selection brushes - Cube and Slice Z - that are additionally available when you are brushing a 3D graph.
- Apply
- Click the Apply button to (manually) execute the Action that you performed on the highlighted data points (these actions are automatically executed if the Selection Brush option is set to Simple and the Auto Apply check box is selected).
- Hide
- Click the Hide button to hide the Brushing 2D/3D dialog from view.
- Quit
- Click the Quit button to deactivate the brushing tool; the Brushing 2D/3D dialog box will be closed. Alternatively, you can press the ESC key on your keyboard to exit the brushing mode. Note that when you exit the brushing mode, highlighting of points on which an Action has not yet been executed (i.e., the points that have not been marked, labeled, etc.) will not be displayed until you re-enter the brushing mode for this graph.
- Plot
- Select either the desired plot or all plots on which to perform brushing from the Plot drop-down box. Use this option to limit the data points that will respond to brushing to only those that belong to a particular plot (e.g., to avoid unintended selection of data points from other plots when using the Lasso or Box brush). This option is only available when (on the Documents/Graphs: Settings tab of the Options dialog box) the Case states/names for multiple plots is set to Separate, and the Data Update method is either Manual or Locked, or the Update spreadsheet case states is turned off (i.e., the check box is cleared). This is to prevent the spreadsheet from automatically updating multiple plots after a user has brushed one specific plot.
- Reset All
- Click the Reset All button to remove all attributes (highlighted, marked, labeled, or turned off) due to the previous actions performed on the selected points of the graph.
- Auto Apply
- Select the Auto Apply check box to automatically update the graph (i.e., execute the current Action) every time you brush a data point with the Simple selection brush. This mode saves time for graphs that are redrawn quickly because you do not have to highlight the data points first and then use the Auto Apply button; they immediately become marked, labeled, etc. Note that this option is available only if your selection brush is Simple.
- Action
- The options in the Action group box are used to perform actions: Mark/Unmark, Label/Unlabel, Exclude/Include, and Hide/Show, and to set the point marker symbol and color for the highlighted points. The actions are executed when you click the Auto Apply button in this dialog (or after every selection with the Simple brushing tool when you are in the Auto Apply mode, see above). Note that the option buttons that are available under Action depend on the selection of the Normal, Rev., and Toggle buttons. Note also that point marker style and color are predetermined for multiple subsets, frequency scatterplot and overlaid categorization. When brushing graphs of these types, the default point marker and color will take precedence over the brushing color/marker. However, the changes made via the brushing tool will be reflected in the spreadsheet and in the Graph Data Editor.
- Normal
- Click the Normal button to display the Mark, Label, Exclude, and Hide option buttons. This is the default setting.
- Rev
- Click the Rev. button to display the Unmark, Unlabel, Include, and Show option buttons.
- Toggle
- Click the Toggle button to display the Toggle mark, Toggle label, Toggle exclude, and Toggle hide option buttons.
- Mark
- Select this option button to mark a point. Marking a point will replace the current point marker(s) of the selected case(s) with different point marker(s).
- Label
- Select this option button to label the selected point(s).
Note: Concerning the following three options: When the Combine Excluded and Hidden Case States into Off state check box is selected in the Options dialog box - Spreadsheets: Navigation / Defaults tab, the Off option (described below) is available on this tab. When the Combine Excluded and Hidden Case States into Off state check box is cleared, the Off option is not available, but the Exclude and Hide options (described below) are available.
- Off
- This option is a combination of the Exclude and Hide options (see descriptions below). See also the Note above this option description. Select this option button to exclude the point from the computations and from the graph.
- Exclude
- Select this option button to exclude the selected point(s). A point that is excluded will not be used in any calculations (e.g., fit line in a scatterplot). It does not affect the visibility of the point. To further explain, a case that is excluded will not be involved in any analysis selected from the Statistics menu as if it were excluded via the selection conditions. However, graphs selected from the Graphs menu such as 2D Scatterplots, Box Plots, and Means w/ Error plots will still display the data point although not use its value in any relevant computations. For example, although an excluded data point is still visibly displayed in a scatterplot, its numeric value is not being used in the computation of the fitted regression line. In the case of the histogram, which is a calculated entity, a case that is excluded will not be used in the calculations involved in the creation of the histogram. For example, if two cases fall in the range (10, 20) and one them is excluded, then the height of the corresponding column for that range will be one. See the Note above the Off option description.
- Hide
- Select this option button to hide the selected point(s). This option only affects the visibility of the point. It does not remove the point from relevant calculations (e.g., fit lines). To explain further, a case that is hidden will not appear in Graphs menu graphs (e.g., 2D Scatterplots, Box Plots, and Means w/ Error Plots that are selected from the Graphs menu). The cases will still be used in all computations for all analyses and graphs. For example, although a data point is not visibly displayed in a scatterplot, its numeric value is used in the computation of the fitted regression line. Another example is that of a box and whisker plot. Although the data point is not visibly seen (if the Display raw data check box is selected) the numeric value of the data point is used in the calculation of the middle point (e.g., median or mean), inner spread, and outer spread. In a histogram, which is a calculated entity, a case that is hidden will still be used in the calculations involved in the creation of the histogram. So, for example, if two cases fall in the range (10, 20) and one of the cases is hidden, the height of the corresponding column for that range will still be two. See the Note above the Off option description.
- Color
- Select this option button and use the adjacent drop-down color palette to change the color of the point marker for the currently selected point(s).
- Marker
- Select this option button and use the adjacent drop-down menu to change the point marker symbol for the currently selected point(s).
- Selection Brush
- The options in the Selection Brush group box are used to select the type of brush to highlight the data points that you want to mark/label on the graph. Simple, Box, Lasso, Slice X, and Slice Y are available for 2D graphs. Slice Z and Cube are added for 3D graphs.
- Simple
- When you select the Simple option button, the cursor will change to a cross-hair and you can highlight individual points on the graph by clicking on them with the cross-hair. Note that, when you are using this selection brush, the options Draggable Brush and Persist selection between brushes will not be available. Also, you cannot enable the animated brushing mode.
- Box
- Select the Box option button to draw a rectangle around a continuous set of points in the graph in order to highlight all the points that fall inside the drawn rectangle.
- Lasso
- Select the Lasso option button to draw (free-hand) a line (Lasso) around the desired points (either continuous or discontinuous) in the graph in order to highlight all of the lassoed points.
- Slice X
- When you select the Slice X option button, the brushing tool can be defined as a vertical rectangle of adjustable width (2D graph) or a box of adjustable thickness along the x-axis (3D graph).
All of the point markers within the rectangle (2D graph) or the box (3D graph) will become highlighted. The corresponding data will also be highlighted (by different color) in the Graph Data Editor.
- Slice Y
- Select the Slice Y option button to define the brushing tool as a vertical rectangle of adjustable width (2D graph) or a box of adjustable thickness along the y-axis (3D graph). All of the point markers within the rectangle (2D graph) or the box (3D graph) will become highlighted. The corresponding data will also be highlighted (by a different color) in the Graph Data Editor.
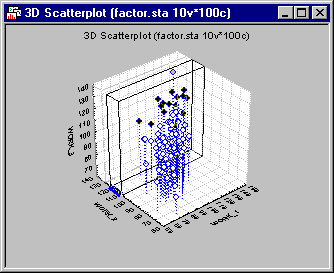
- Slice Z
- Select the Slice Z option button to define the brushing tool as a box of adjustable thickness along the z-axis. All of the point markers within the box will become highlighted. The corresponding data will also be highlighted (by different color) in the Graph Data Editor. Note that this selection brush is available only if you are brushing a 3D graph.
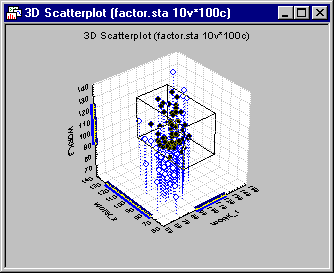
- Cube
- Select the Cube option button to draw a box of adjustable dimensions around a continuous set of points in the graph. Note that this selection brush is available only if you are brushing a 3D graph.
All of the point markers within the box will become highlighted.
- Draggable Brush
- If you want to use one of the four shape defining selection brushes (i.e., Box, Lasso, Slice X, or Slice Y ) for a 2D graph or one of the six shape-defining brushes (i.e., Box, Lasso, Slice X, Slice Y, Slice Z, or Cube) for a 3D graph and manually control its animation, then first select the Draggable Brush check box. You can then select the data points via any of these brushes and drag that shape to any position on the graph to perform the desired brushing action.
- Persist selection between brushes
- When the Persist selection between brushes check box is selected, the status of already highlighted data points is not changed as a result of the next application of the selection brush.
- Auto Animate
- If the Auto Animate check box is selected and the Animate button is clicked (see below), the shape defining brush in use will start scanning the plot area of the graph to visit all the data points on the graph. For example, with a strip shaped brush on a 2D graph, the strip will move back and forth on the x-axis (Slice X), or up and down on the y-axis (Slice Y), successively highlighting the points that fall within the strip. Similarly, on a 3D graph a box shaped brush, for example, will back and forth (Slice X) along the x-axis; back and forth (Slice Y) along the y-axis; or up and down (Slice Z) along the z-axis. The movement of the slices can be controlled by the options in the Animation dialog box that is displayed when the animation starts.
- Animate
- During animation, a shape defining brush (Simple, Box, Lasso, Slice X, Slice Y, Slice Z, or Cube) moves in steps over the plot area with the desired waiting time between two steps. Click the Animate button to display the Animation dialog box, in which you can specify both step size and the waiting time to control the movement of the selection brush in use.
- Save Brushing settings
- Select the Save Brushing settings check box to save the settings that you used in the current brushing session until the next session. For example, if in the current session you have last used the Lasso Selection Brush and the Save Brushing settings check box is selected, then after exiting, Statistica will remember that your last Selection Brush used in the previous session was the Lasso brush; you will find this brush already selected on this tab.
Copyright © 2021. Cloud Software Group, Inc. All Rights Reserved.