What are statistics of block data?
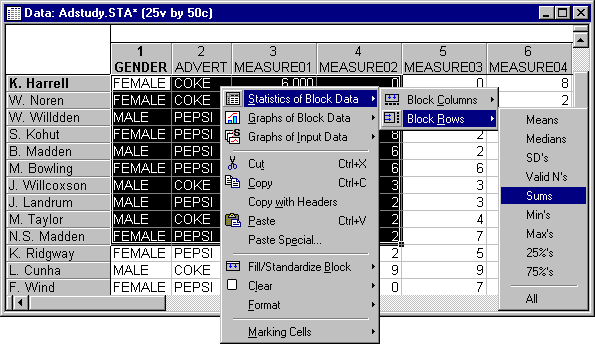
Statistics for each row or column in a selected block can be computed and displayed in a separate spreadsheet by selecting the desired Statistics of Block Data from the shortcut menu.

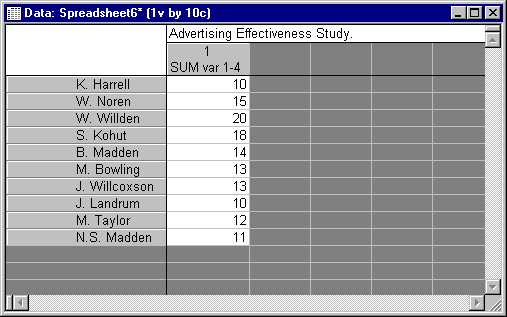
The selected statistics are added to the new spreadsheet as rows or columns. For example, the selection shown above computes the sums for each row in the selected block and displays them in a new datafile as the variable Sum.

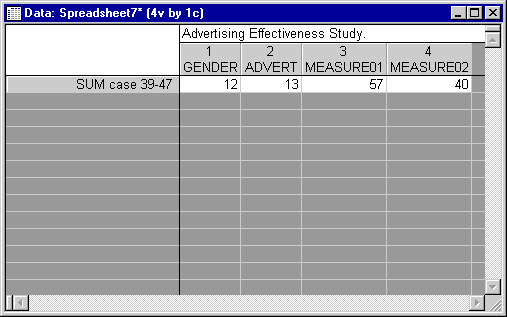
If you select Block Columns, the results of the selected statistic are displayed as case(s), and the case name contains the name of the selected statistic and the range description, as shown below.

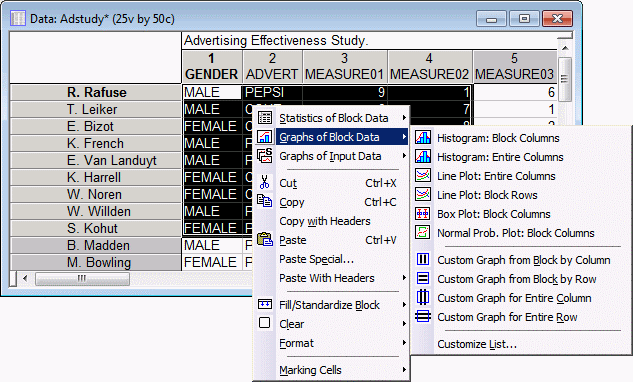
In addition, a (customizable) list of predefined graphs is also available from this shortcut menu.

These Graphs of Block Data allow you to visualize the data in the selected block either by row or by column.
