Example 3: Observed vs. Expected Chi-Square
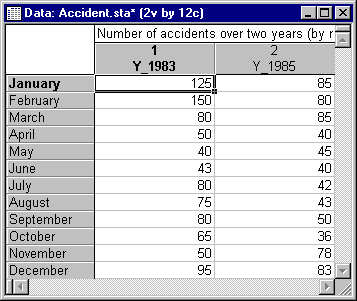
This example is based on a (fictitious) data set of traffic accidents on a particularly treacherous highway (the data for this example are contained in the example data file Accident.sta). The data are recorded for each month of the year, for two years: 1983 and 1985. Open this data file via the File - Open Examples menu; it is in the Datasets folder.
Imagine that a considerable amount of money had been spent in 1984 to improve the safety of traffic on that highway. If these improvements were in vain (the null hypothesis), then the number and distribution of traffic accidents in 1985 can be expected to be the same as in 1983 (provided that the overall amount and nature of traffic has not changed). Thus, the data for 1983 will serve as the expected values here, and the data for 1985 will serve as the observed values.
- Specifying the analysis
- Select Nonparametrics from the Statistics menu to display the Nonparametric Statistics Startup Panel. Next, select Observed versus expected X2 on the Quick tab, and then click the OK button to display the Observed vs. Expected Frequency dialog. Click the Variables button to display the standard variable selection dialog. Select variable Y_1985 as the Observed frequencies, variable Y_1983 as the Expected frequencies, and then click the OK button.
- Reviewing the results
- Now, click the Summary button to display a spreadsheet with the results of the analysis.
Apparently, there has been a highly significant drop in the number of traffic accidents between 1983 and 1985.
Note: the spreadsheet contains the totals across months at the bottom (Sum); the differences between the observed and the expected values are displayed in the third column, and the squared differences divided by the expected values (components of Chi-square) are displayed in the fourth column of the spreadsheet.See also, Nonparametric Statistics - Index.


