Example 1.1: Designing and Analyzing a 2(7-4) Fractional Factorial Design
Box, Hunter, and Hunter (1978) report the results of a (hypothetical) experiment that nicely demonstrates how to design and analyze a fractional factorial design at two levels. Suppose a person is asked to cycle up a hill on consecutive days. The purpose of the study is to determine the effect of 7 different factors on the speed with which the person can climb the hill. These factors are:
- Seat position (up or down),
- Whether or not the dynamo is turned on,
- Position of the handlebars (up or down),
- Particular gear selection (low or medium),
- Whether or not the person is wearing a raincoat,
- Whether or not the person had breakfast in the morning, and
- Whether hard or soft tires are used on the bicycle.
The design for this study will first be generated and then the results will be analyzed.
- Designing the experiment
- Start the Experimental Design (DOE) analysis.
Ribbon bar. Select the Statistics tab, and in the Industrial Statistics group, click DOE to display the Design & Analysis of Experiments dialog box.
Classic menus. On the Statistics - Industrial Statistics & Six Sigma submenu, select Experimental Design (DOE) to display the Design & Analysis of Experiments dialog box.
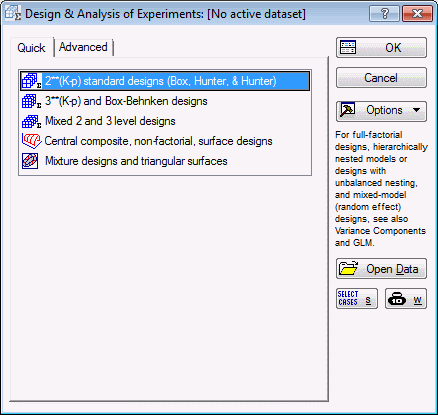
Select 2**(K-p) standard designs (Box, Hunter, and Hunter).
Click the OK button to display the Design & Analysis of Experiments with Two-Level Factors dialog box.
Select the Design experiment tab.
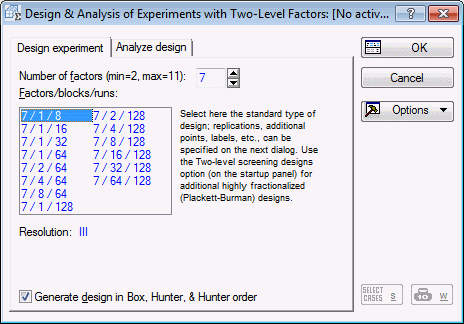
Enter 7 as the Number of factors, and select design 7/1/8 (7 factors, 1 block, 8 runs).
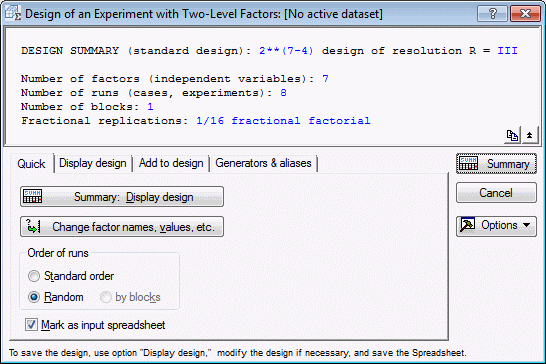
Note: if you were to run a full factorial experiment, you would need 27=128 runs; in this example, since you can only make the subject cycle up the hill once a day, the study would require a full 128 days. Even though this is a fictitious scenario, similar constraints often occur in industrial experimentation. For example, a kiln can only be fired up once a day, only a single complete batch of products is produced every day, etc. Using a fractional factorial design, you can complete the present study in only 8 days.Examining the design. In the Design & Analysis of Experiments with Two-Level Factors dialog box, click the OK button to display the Design of an Experiment with Two-Level Factors dialog box, which contains numerous output options for reviewing the design.
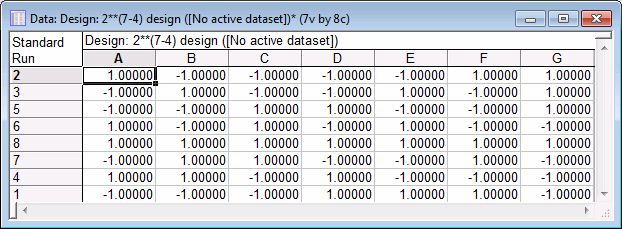
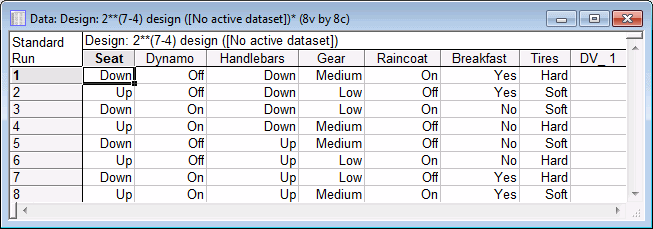
First, examine the runs in the design. For now, accept the default selections on the Quick tab, and click the Summary: Display design button to display a spreadsheet specifying the settings for each experimental run.
- Naming of factors
- By default, the factors are denoted by names, as entered into the Summary for Variables (Factors) dialog box. (This option will be examined shortly.) You can also denote factors by letters (A, B, etc., as illustrated above), or by numbers (F1, F2, etc.).
- Continuous and qualitative (categorical) factors
- Statistica distinguishes between continuous factors and qualitative (or categorical) factors. Continuous factors are variables in the experiment that can be varied continuously; qualitative factors represent distinct categories that cannot be varied continuously.
For example, if you are using two machines in your experiment and want to include a Machine factor in the design, that factor would be qualitative since you either use one machine or the other, and you cannot set this factor to a level in between. Alternatively, Seat Position, which is one of the factors in this example experiment, is a continuous variable, because the height of the seat position can be varied continuously between the up and down positions.
Continuous factors are indicated in the spreadsheet by the notation (Cont.) in the column heading if letters or numbers are used instead of factor names.
- Continuous factors and center-points
- The distinction between continuous and categorical factors is important when you want to add center points to the design. Center points are runs where all continuous factors are set at their center position. This will enable you later to perform, for example, tests for the presence of curvature and, thus, for the validity of the simple linear-effects model. This issue is discussed in greater detail in the Introductory Overview.
Categorical variables cannot be set at their center levels and, thus, for every center point requested via the center points option in the Design of an Experiment with Two-Level Factors dialog box, Statistica will construct a full factorial design for the categorical variables in the design.
- Factor levels (metric)
- By default, Statistica will denote the factor settings (levels) by the respective factor high and low values. Those can be changed in the
Summary for Variables (Factors) dialog box (see below). Alternatively, you can use the standard ±1 (0 for center points) notation. You can also use text values to denote the high and low settings of the factors.
Note: when you save the spreadsheet (you can later use it to enter the results of the experiments), Statistica will either 1) save the numbers as displayed in the spreadsheet, or 2) save the text values as displayed in the spreadsheet along with the ("underlying") factor highs and lows.
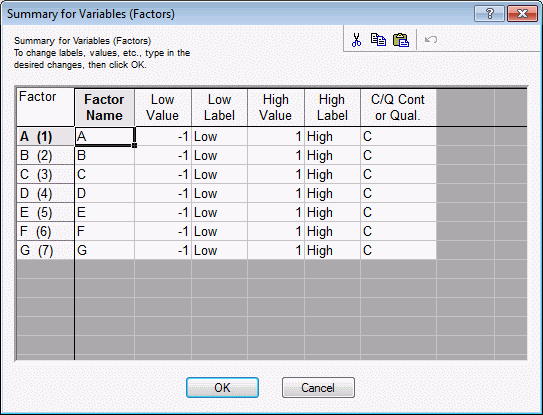
Customizing the default design, saving the design. Return to the Design of an Experiment with Two-Level Factor dialog box, and click the Change factor names, values, etc. button to display the Summary for Variables (Factors) dialog box.
This dialog box not only displays the factor names, highs and lows, etc., but you can also modify the values. For example, enter the following values:
You have now given the factors and the factor settings more meaningful names. For this example, the actual low and high values were not changed. If you exit this dialog box by clicking the OK button, all specifications entered here will be read by Statistica (and will be used in subsequent spreadsheets). If you close the dialog box in any other way, the changes will be discarded.
Now, click the OK button to return to the Design of an Experiment with Two-Level Factor dialog box.
- Randomizing runs
- To randomize the runs in the design, you would select the Random option button in the Order of runs group box on the
Quick tab. Randomization of runs is very important, so that other systematic factors outside the experiment will not bias the result. For example, in the present study, suppose we collected first all runs with a breakfast, and then, on the last days of the study, without. It is conceivable that this systematic order would influence our results; namely, the cyclist might become used to a good breakfast every morning and, hence, his or her performance would deteriorate more markedly on the first two days when no breakfast is permitted prior to the experimental run.
Randomization of runs assures that all such systematic influences affect the experiment in a random (non-systematic) manner and, thus, that they will hopefully "even out" in different experimental runs.
For this example, however, select the Standard order option button.
- Adding blank columns
- To add blank columns to the spreadsheet, click on the Add to design tab and enter 1 in the Number of blank columns (dep. vars) box, or use the microscrolls to adjust the number. The spreadsheet can then be used as a data entry form or be printed to use to record the data.
- Replications, foldover
- In the Number of genuine replicates box on the Add to design tab, you can specify how often you want to repeat the standard design; if you select the Foldover (enhance resolution) check box, a copy of the design will be appended to the end of the design with all signs reversed, i.e., with all high-settings set to low, and vice versa. Both of these options are discussed in the Introductory Overview and will not be used here.
- Displaying the customized design
- Click on the
Display design tab. In the Denote factors group box, select the By names option button.
In the Order of runs group box, select the Standard order option button.
In the Show (in Spreadsheet) group box, select the Text labels option button.
Now, click on the Quick tab and click the Summary: Display design button to produce the spreadsheet.
- Saving the design
- To save the design:
Ribbon bar. On the Home tab, click Save.
Classic menus. On the File menu, select Save.
Reviewing the design characteristics.
Reviewing design generators. As discussed in the Introductory Overview, 2(k-p) fractional factorial designs "sacrifice" interactions to allow main effects to be estimated with fewer runs than would be required by a full factorial. Without going into the details of this procedure, the logic of it is as follows (see Box and Draper, 1987; Box, Hunter, and Hunter, 1978; Mason, Gunst, and Hess, 1989; or Ryan, 1989).
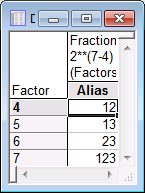
First, you take the full factorial that can be constructed based on the respective number of runs; in this case, 8 runs can accommodate a 3-factor complete factorial design. Next, the program "sacrifices" the highest-order interactions in that design to "create" new factors (main effects). This process is summarized in the notation that is used to refer to fractional designs: In this example, you have a 2(7-4) design. This means that you have seven factors overall, four of which were created as aliases of interactions. To see which interactions were sacrificed, review the design generators by clicking on the Generators & aliases tab and clicking the Generators of fractional design button.
It turns out that factor 4 was created from the interaction of factor 1 by 2; factor 5 was created from the interaction of factor 1 by 3; and so on.
- Resolution
- The Introductory Overview introduces the concept of design resolution. Briefly, the resolution of the design indicates the extent to which factors of a particular order are confounded. To reiterate, a design of resolution R is one where no l-way interactions are confounded with any other interaction of order less than R-l.
In the current example, R is equal to 3; therefore, no l=1 level interactions (i.e., main effects) are confounded with any other interaction of order less than R-l=3-1=2. Thus, the main effects in this design are confounded with the two-way interactions.
Close the analysis and all related spreadsheets.
Analyzing the design. Next, we will analyze the data obtained for the experiment. Box, Hunter, and Hunter (1978, page 391) report the following (fictitious) results. Open the data file Cycling.sta:Ribbon bar. Select the Home tab. In the File group, on the Open menu, select Open Examples to display the Open a Statistica Data File dialog. Double-click the Datasets folder, and then open the data set.
Classic menus. On the File menu, select Open Examples to display the Open a Statistica Data File dialog. The data file is located in the Datasets folder.
Specifying the design. Start the Experimental Design (DOE) analysis:
Ribbon bar. Select the Statistics tab, and in the Industrial Statistics group, click DOE to display the Design & Analysis of Experiments Startup Panel.
Classic menus. On the Statistics - Industrial Statistics & Six Sigma submenu, select Experimental Design (DOE) to display the Design & Analysis of Experiments Startup Panel.
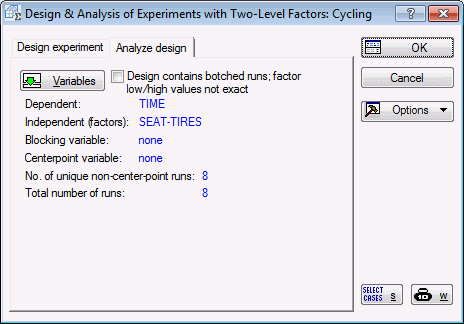
Select 2**(k-p) standard designs (Box, Hunter, and Hunter), and click the OK button. In the Design & Analysis of Experiments with Two-Level Factors dialog box, click on the Analyze design tab. Click the Variables button to select the Dependent and Indep. (factors). The dependent variable in this case is variable Time, which contains the times that the person required to cycle up the hill; variables Seat through Tires are the independent variables because they contain the codes (+1,-1) that uniquely identify to which group in the design the respective case belongs. After selecting the variables, click the OK button. The Design & Analysis of Experiments with Two-Level Factors dialog box will look like this.
- Reviewing results
- Click the OK button and the
Analysis of an Experiment with Two-Level Factors dialog box is displayed.
Some of the options available in this dialog box are the same as the options in the dialog box resulting from generating a design. Thus, on the Design tab, you could display the design, review the aliases, etc. Some of the new options are described below.
- Main effects
- Select the
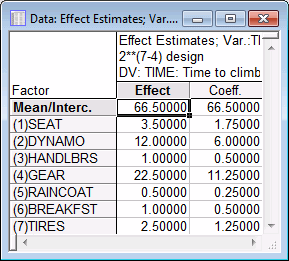
ANOVA/Effects tab and click the Summary: Effect estimates button to produce a spreadsheet with the effect estimates.
By default, Statistica fits a simple main effects model without interactions. [Remember that the design is of resolution III (3); hence, the two-way interactions are confounded with the main effects, and they cannot be estimated from this design.] The first numeric column of the spreadsheet shown above contains the Effect estimates. These parameter estimates can be interpreted as deviations of the mean of the negative settings from the mean of the positive settings for the respective factors. So, for example, when the seat position went from down (-1) to up (+1), the time to climb the hill increased by an average of 3.5 seconds.
The second numeric column contains the effect Coefficients. These are the coefficients that could be used for the prediction of climb-time for new factor settings via the linear equation:
ypred. = b0 + b1*x1 + ... + b7*x7
where ypred. stands for the predicted climb-time, x1 through x7 stand for the settings of the factors (1 through 7), b1 through b7 are the respective coefficients, and b0 stands for the intercept or mean.
Note that, for this design, the spreadsheet of effect estimates does not show the standard errors for the parameters or tests of statistical significance. This is because this is a saturated design, where all degrees of freedom (i.e., information) are used to estimate the parameters, and no independent assessment of the error variance is available.
To summarize the results so far, it appears that the gear selection (low is better, that is, leads to shorter climbing time) and the dynamo setting (off is better) had the largest impact on the person's speed when cycling up the hill.
- Analysis of variance
- Now, return to the
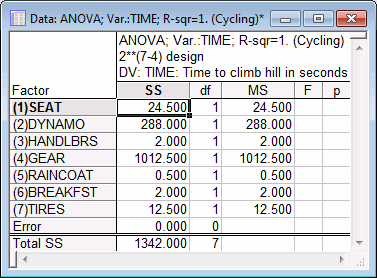
ANOVA/Effects tab. You can view the sum of squares associated with each factor by clicking the ANOVA table button.
As you can see, in this example there are no degrees of freedom remaining for the Error. Put another way, all of the information in the data was used up to estimate the factor effects (sums of squares).
Again, the largest proportion of variance in the person's climbing time can be explained by the Gear factor; the Dynamo factor explains only about a quarter as much of the variability, and the remaining factors seem rather insignificant.
- Pooling effects into error
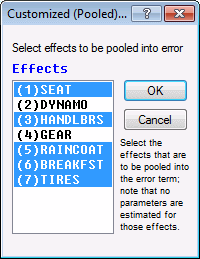
- Let's assume for the moment, that, with the exception of Dynamo and Gear, all other factors are not important, and any differences between the high and low settings for those factors are mostly due to random variability. In this case, we could pool the variability for those factors together to obtain an estimate of the error variability, that is, the variability that cannot be explained by the Dynamo and Gear factors. To accomplish this, click on the
Model tab and select the Ignore some effects check box in the Include in model group box. In the
Customized (Pooled) Error Term dialog box, select all factors except Dynamo and Gear to be pooled together.
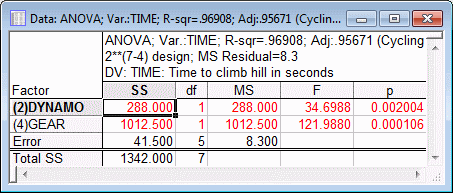
Click OK, and then return to the ANOVA/Effects tab. Click the ANOVA table button to display the ANOVA table again.
Now only the two factors Dynamo and Gear are included and tested for statistical significance against the residual or Error variability. In this particular case, we should be careful not to interpret the p values too literally. Those values assume that we hypothesized a priori, that the two factors Dynamo and Gear would be the only important factors in the experiment; however, we made this determination after looking at the results, that is, post hoc. To use a "loose" metaphor, it is as if we predicted the winning lottery numbers after we read the numbers in the paper; clearly we can do much better than what would be expected by pure chance. Nevertheless, it is instructive to see the F-ratios, which, as usual, are the ratios of the respective mean-square-effect and the mean-square-error. Statistica can also construct confidence intervals for the ANOVA parameter estimates based on the pooled estimate of error.
Return to the ANOVA/Effects tab, and click the Summary: Effect estimates button again.
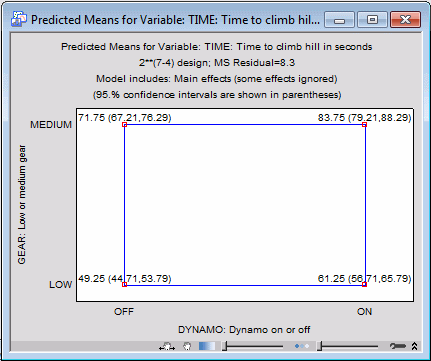
- Square plot
- One way to summarize the results in a graph is to produce a Square plot of predicted means for two factors, or a Cube plot of predicted means for three factors.
Select the Quick tab.
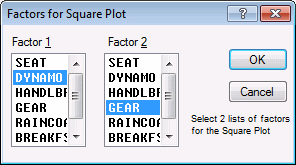
Since there are two factors that seem to be most important in this study, click the Square plot of predicted means button in the Predicted (estimated) means group box. In the Factors for Square Plot dialog box, select the two factors Dynamo and Gear,
and then click OK.
This plot shows the predicted means for the low and high settings for the two factors when all other factors are at their respective mean (i.e., 0 in coded form). Also included are the confidence intervals for the predicted means, based on the pooled error term.
- Pareto chart of effects
- Another useful plot for identifying the factors that are important is the Pareto chart of effects.
To produce this plot for all main effects, select the Model tab and clear the Ignore some effects check box in the Include in model group box.
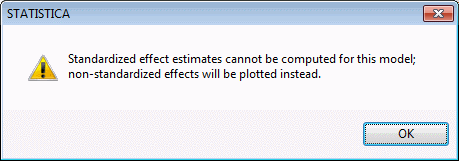
Then, select the Quick tab, and click the Pareto chart of effects button. A message will be displayed informing you that the default plot for standardized effects cannot be produced because, as discussed earlier in this example, when all effects are estimated there are no degrees of freedom left to estimate the error variability.
Disregard the message (click OK) to produce the plot of the non-standardized effects.
This graph will show the ANOVA effect estimates plotted against the horizontal axis. If there is an estimate of error variability available, this plot (for standardized effects) will also include a vertical line to indicate the p=.05 threshold for statistical significance (see Example 1.2). This plot is particularly useful for presenting the results of experiments to laymen who are not familiar with the interpretation of numerical results from ANOVA.
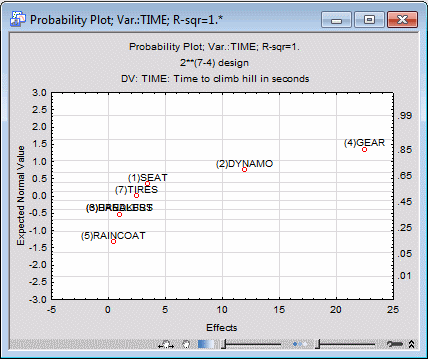
- Normal probability plot of effects
- A more technical graph that contains similar (but more) information is the normal probability plot of effects.
Select the ANOVA/Effects tab. Before producing the plot, ensure that the Label points in normal plot check box is selected. Then, click the Normal probability plot button in the Plots of effects group box.
This plot is constructed as follows. First, the effect estimates are rank ordered. From these ranks, z values (i.e., standard values of the normal distribution) can be computed based on the assumption that the estimates come from a normal distribution with a common mean. These z values are plotted on the left-Y axis in the plot, and the corresponding normal probabilities are shown on the right-Y axis in the plot. If the actual estimates (plotted on the X-axis) are normally distributed, all values should fall onto a straight line in the plot. This plot is very useful for separating random noise from "real" effects. The estimates for effects that are actually zero in the population will assume a normal distribution around a common mean of zero; effects that "truly exist" will be shown in this plot as outliers.
In the plot above, again the points (marked in the plot) for the Gear and Dynamo main effect appear different from the other effects.
Summary. We conclude from this study that the most significant factor affecting a person's speed when cycling up a hill is the proper gear selection. There also is an indication that the dynamo setting has an effect, although that effect is not nearly as strong.
See also, Experimental Design Index.