Graph Data Editor Overview
The Graph Data Editor is a special version of the spreadsheet that you can use to review directly the data that are plotted in the graph. This tool is useful for a variety of analytic applications, such as brushing or other forms of identifying specific data points. It also offers (sometimes) the only way to access data from those graphs that do not plot raw values but values that have been derived, transformed, or result from specific analytic calculations, as well as values of the fitted functions. It can also be used to add additional plots of a compatible type to an existing graph. This editor is available from the graph View menu, the graph Format menu, and the general graph shortcut menu (accessible by right-clicking on the background of any graph).

- Columns in the Graph Data Editor
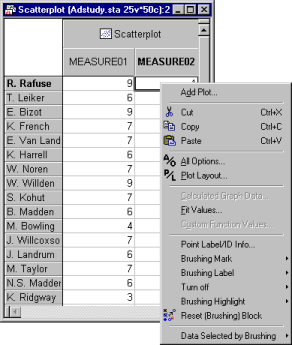
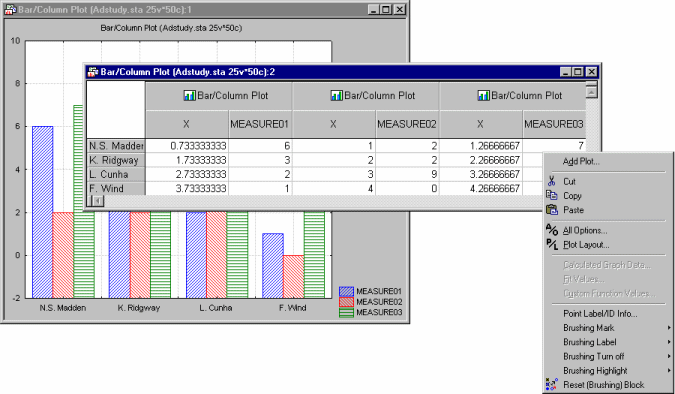
- Each Statistica graph carries with it a copy of all relevant data from the input data set or spreadsheet upon which the graph is based. The type and amount of data associated with a particular graph is a function of the type of graph as well as the specific options chosen in making the graph. For example, a simple histogram carries with it only a copy of the variable upon which the histogram is based. A simple two-variable scatterplot (shown in the illustration above) contains copies of both variables involved. Graphs with multiple plots contain copies of the relevant variables for each plot on the graph. As illustrated below, the Graph Data Editor for the bar/column plot contains three plots, with each plot having two variables: the numeric value for the x-axis (representing the locations of the columns on the x-axis) and the actual values for the variable (Measure01, Measure02, Measure03, respectively).

- Supplementary data values
- Additional variables used in categorization of plots are also stored with the graph when it is created. Also, when graphs are made using the Multiple Subsets options for data division, a copy of all variables in the data set will be stored with the graph to allow for subsequent interactive modification of the multiple subset conditions - which may potentially involve any variables in the data set. (Note that this example illustrates well the function of the Graph Data Editor - namely, it contains all data that allow you to change the layout and analytic characteristics of the graph even if the original data set is not available, e.g., when the graph file is sent to a different computer without the original data set.)
- Data in the Graph Data Editor
- The data displayed in the Graph Data Editor are the raw data values for each plot. Data are organized in the editor under headers identifying the specific plot type to which the data apply. For plot types (such as histograms) in which the raw data are not directly plotted on the graph, select Calculated Graph Data from the Graph Data Editor shortcut menu to display the calculated graph data (for example, the heights of columns - i.e., counts - representing specific frequencies in a histogram, as shown below).

These data points cannot be edited in place; however, they can be copied and graphed separately or added to other graphs.
- Fit values in the Graph Data Editor
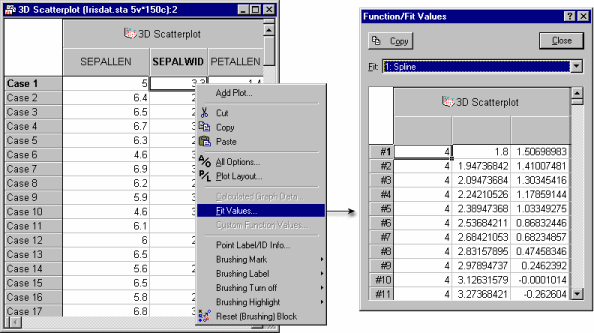
- If the graph contains a fit line or multiple fit lines, the coordinates of the segments of each line can be viewed by selecting Fit Values from the shortcut menu.

Use the Fit box at the top of the Function/Fit Values dialog to select the appropriate fit (if there is more than one fit in the graph), and again the data can be copied for separate analytic operations or addition to other graphs. The number of segments in a given fit line can be altered using the Resolution option found on the Plot: Fitting tab of the Graph Options dialog box. Custom functions that have been applied to a graph can be viewed/copied in a similar fashion by selecting Custom Function Values from the shortcut menu.
- Changing data values
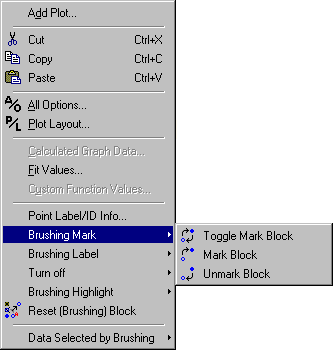
- Raw data can be changed, deleted, copied from, or pasted into the columns of the Graph Data Editor. Changes in data values are immediately reflected in the active graph. The Graph Data Editor can be used both independently and in conjunction with the graph brushing tools to explore relationships among graph data or to identify specific data points or subsets of data points. Convenient data exploration options are available from the shortcut menu and from toolbar buttons when the Graph Data Editor is open. The options include marking, labeling, and turning off specific points on the plot.

An additional option for highlighting specific points is available when the Brushing dialog box is open. Each of these options can be toggled, turned on, or turned off for points selected in the Graph Data Editor.
- Appearance of data values
- Data for selected cases or blocks of cases when designated as marked (either by direct action from within the Graph Data Editor or by using the brushing tools), will be displayed as bold in the Graph Data Editor, and the corresponding point markers on the graph will be changed.
If cases are selected for labeling, the data in the Graph Data Editor will be displayed in italics, and the selected cases will be labeled on the graph.
On the shortcut menu, a Point Label/ID Info option allows editing the labels to be posted.
Cases selected to be turned off will be displayed in the Graph Data Editor with a darkened background and the points will be removed from the graph, causing any fit lines applied to the plot to be recalculated.
If the Brushing dialog box is open, cases selected and designated for highlighting will be highlighted by use of a different point marker on the graph and their data displayed in the Graph Data Editor in red.
Cases in the Graph Data Editor that fall under more than one of the categories described above will have multiple overlaid formats applied, (e.g., a case that is both labeled and marked will be displayed in bold italics).
- Additional toolbar buttons and shortcut options
- A Reset Brushing Block feature is available on the toolbar and shortcut menu to simultaneously remove all marked, labeled, and turned-off designations from the selected points. Toolbar buttons and shortcut menu options are also provided to quickly access the Graph Options dialog box from the Graph Data Editor.
- Adding new plots
- Click the
 button on the toolbar to display the New plot(s) dialog box and define a new plot for the graph.
Once you have specified the what type of plot to add, the appropriate number of columns will be created in the Graph Data Editor, and you can enter the values to use in the plot.
